

Release Date :
Reference Number :
2025-SR-029
Table A. Year-on-Year Inflation Rates for the Bottom 30% Income Households: Philippines, MIMAROPA, and Palawan
All Items, In Percent (2018=100)
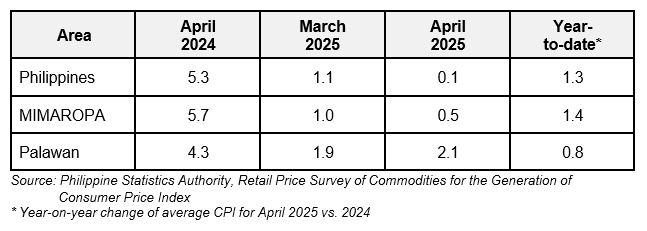
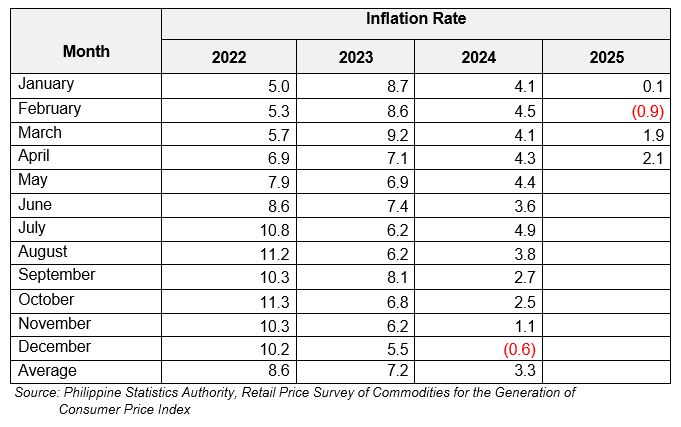
Palawan’s inflation rate for the bottom 30% income households increased to 2.1 percent in April 2025 from 1.9 percent in March 2025. In April 2024, inflation rate was posted at
4.3 percent. (Table A and Figure 1)
The primary driver behind the upward trend in provincial inflation for this income group in April 2025 was the notable increase in the year-on-year growth of the food and non-alcoholic beverages sector, which rose to 2.1 percent from 1.7 percent in March 2025. Additionally, contributions to the overall inflation rate came from the restaurants and accommodation services sector, which increased to 8.4 percent from 7.3 percent, and the housing, water, electricity, gas, and other fuels sector, rising to 1.0 percent from 0.8 percent. Moreover, higher inflation rates were also noted in the indices of alcoholic beverages and tobacco at 2.4 percent in April 2025 from 1.3 percent in March 2025, personal care, miscellaneous goods and services at 3.3 percent during the month from 3.1 percent in the previous month, and clothing and footwear at 1.5 percent in the current month from
1.4 percent in March 2025.
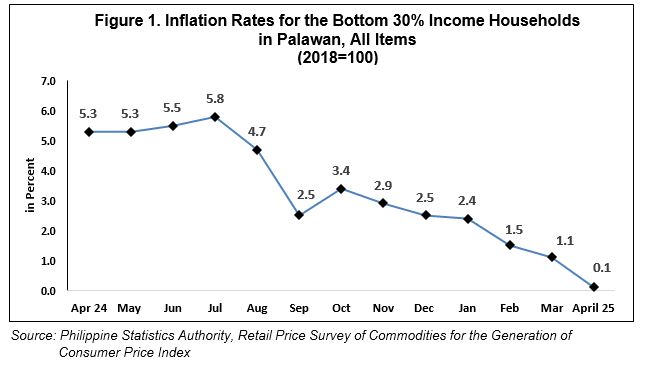
Table B. Year-on-Year Inflation Rates for the Bottom 30% Income Households in Palawan, All Items, In Percent
(2018=100)
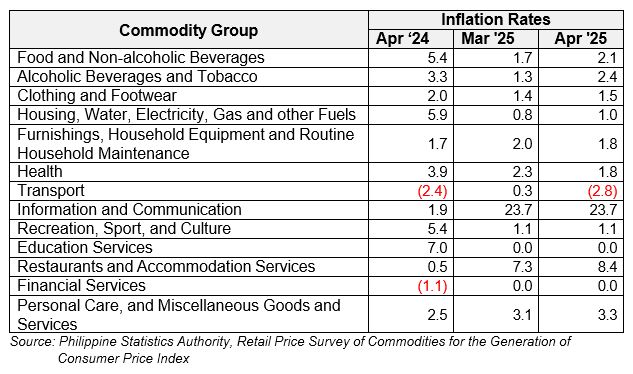
In contrast, lower annual growth rates were noted in the indices of furnishings, household equipment and routine household maintenance at 1.8 percent in April 2025 from 2.0 percent in March 2025, health at 1.8 percent in the current month from 2.3 percent last month, and transport at 2.8 percent annual decline in April 2025 from 0.3 percent in the previous month.
Further, the indices of information and communication, recreation, sport and culture, education services, and financial services retained their respective March 2025 annual rates.
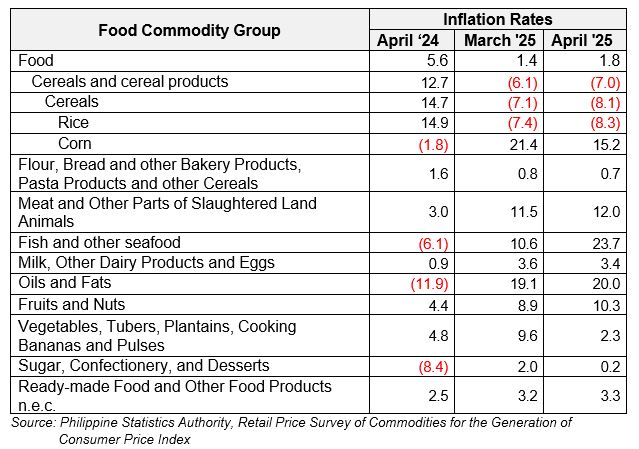
Food inflation for the bottom 30% income households in Palawan grew at a slower rate of 1.8 percent in April 2025 from 1.4 percent the previous month. In April 2024, its annual increase was observed at 5.6 percent. (Table C)
The uptrend in the food inflation in the province was mainly due to the higher growth in the fish and other seafood index at 23.7 percent in April 2025 from 10.6 percent in March 2025, fruits and nuts at 10.3 percent in the current month from 8.9 percent in the previous month, and meat and other parts of slaughtered land animals at 12.0 percent in April 2025 from 11.5 percent during the past month.
Moreover, higher annual increases were also noted in the food groups of oils and fats and ready-made food and other food products n.e.c., at 20.0 percent and 3.3 percent during the month from their respective previous months rates of 19.1 percent and 3.2 percent.
On the other hand, the following food groups posted lower inflation rates in April 2025:
a.) Rice, -8.3 percent from -7.4 percent;
b.) Corn, 15.2 percent from 21.4 percent;
c.) Flour, bread and other bakery products, pasta products and other cereals, 0.7 percent from 0.8 percent;
d.) Milk, other dairy products and eggs, 3.4 percent from 3.6 percent;
e.) Vegetables, tubers, plantains, cooking bananas and pulses, 2.3 percent from 9.6 percent, and
f.) Sugar, confectionery and desserts, 0.2 percent from 2.0 percent.
Table D. Year-on-Year Inflation Rates for the Bottom 30% Income Households in Palawan, All Items, In Percent
January 2022 – April 2025
(2018=100)
(SGD) DONNA MARIE D. MOBE
(Supervising Statistical Specialist)
Officer-In-Charge
Palawan Provincial Statistical Office
CBM