

Release Date :
Reference Number :
2023-12
City of Puerto Princesa
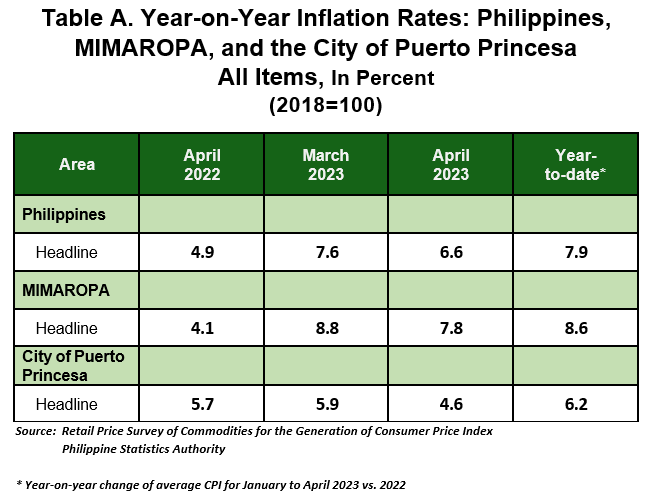
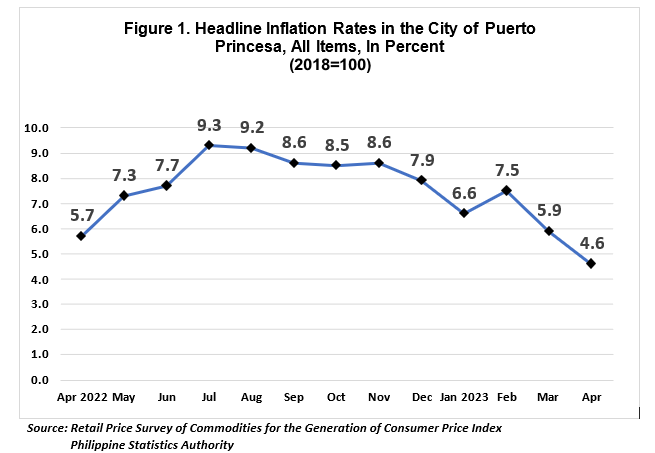
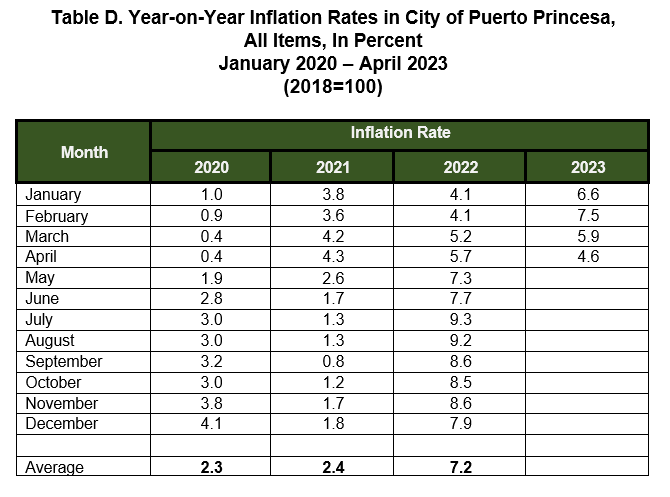
The headline inflation in the City of Puerto Princesa further decelerated to
4.6 percent, from 5.9 percent in March 2023. In April 2022, the headline inflation was lower, at 5.7 percent. The average inflation rate for the first four months of the year stood at 6.2 percent, (Table A and Figure 1).
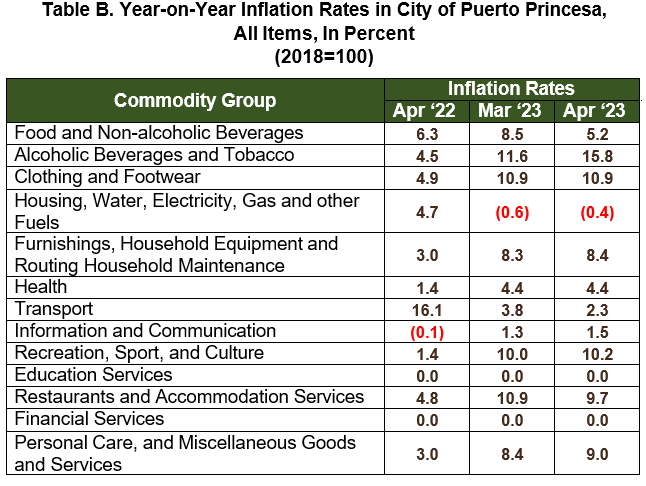
The decline of the City’s inflation rate was caused by the significantly weighted Food and Non-Alcoholic Beverages which recorded a lower inflation rate of
5.2 percent from 8.5 percent in March 2023. This was followed by Transport with an inflation rate of 2.3 percent from 3.8 percent in the previous month. The third primary contributor to the decline was Restaurants and Accommodation Services at 9.7 percent from 10.9 percent inflation last month (Table B).
On the contrary, higher increments were observed in the following commodity groups:
a. Personal Care, and Miscellaneous Good and Services, 9.0 percent;
b. Furnishings, Household Equipment and Routine Household Maintenance, 8.4 percent;
c. Alcoholic Beverages and Tobacco, 15.8 percent;
d. Recreation, Sport and Culture, 10.2 percent;
e. Information and Communication, 1.5 percent.
f. Housing, Water, Electricity, Gas and Other Fuels, -0.4 percent.
Meanwhile, the rest of the commodity groups retained their previous month’s inflation rates.
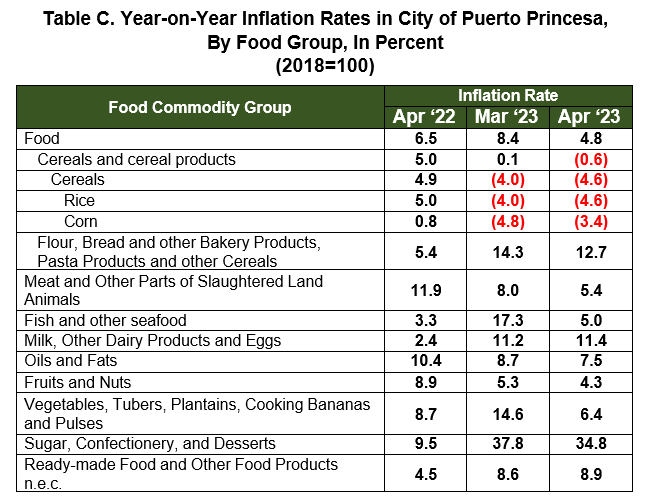
Food inflation in April 2023 further decelerated to 4.8 percent from 8.4 percent in the previous month. In April 2022, the food index was higher at 6.5 percent inflation rate, (Table C).
The main drivers for the lower food inflation were Fish and Other Seafood at
5.0 percent, from 17.3 percent in March 2023. This was followed by
Vegetables, Tubers, Plantains, Cooking Bananas and Pulses at 6.4 percent inflation rate from 14.6 percent one month ago. The third primary driver to the slowdown was Meat and Other Parts of Slaughtered Land Animals at 5.4 percent inflation rate from 8.0 percent last month.
Also contributing to the slowdown were the lower indices observed in the following commodities:
a. Rice, -4.6 percent;
b. Flour, Bread and other Bakery Products, Pasta Products and other Cereals, 12.7 percent;
c. Sugar, Confectionery and Desserts, 34.8 percent;
d. Fruits and Nuts, 4.3 percent; and
e. Oils and Fats, 7.5 percent.
On the other hand, the indices of the following commodity groups posted higher inflation rates during the month:
a. Sugar, Confectionery, and Desserts, 34.8 percent;
b. Ready-made Food and Other Food Products n.e.c., 8.9 percent; and
c. Corn, -3.4 percent;

| Attachment | Size |
|---|---|
|
|
379.95 KB |