Explanatory Notes Data on deaths presented in this release were obtained from the Certificates of Death (Municipal Form No. 103) that were registered at the Office of the City/Municipal Civil Registrars all throughout the country and forwarded to the Philippine Statistics Authority. This release shows an overview of the re Information of the registered deaths that occurred from January to December 2022. Deaths of Filipinos that occurred abroad which were reported to the Philippine Foreign Service Posts are presented in a separate report. The figures shown were not adjusted for under registration. |
An average of 52 deaths registered per day
The Philippines reported 679,766 deaths in the year 2022, which is a decrease of 22.7 percent from the 879,429 registered deaths in 2021. This is equivalent to crude death rate1 of 6.1 or six deaths per 1,000 population in 2022. This corresponds to an average of 1,862 deaths per day, which translates to 78 deaths per hour in 2022.
In 2022, a total of 18,966 deaths were registered in the MIMAROPA Region, which is a decrease of 17.3 percent from 22,934 in 2021. This is equivalent to a crude death rate of 5.8 or 6 deaths per 1,000 population in 2022. On average, this corresponds to 52 deaths per day, which translates to two deaths per hour.
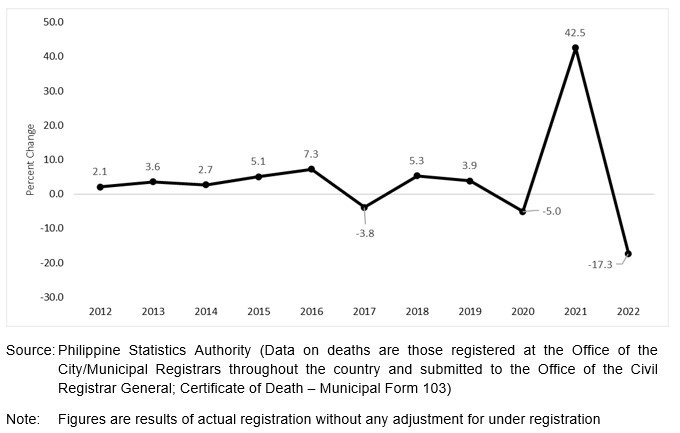
The number of registered deaths in the MIMAROPA Region showed an increasing trend from 2011 to 2022, except in the years 2017 (with a decrease of 3.8 percent), 2020 (5.0 percent decrease), and 2022 (17.3 percent decrease). The increase during the twelve-year period was 44.2 percent, from 13,154 in 2011 to 18,966 in 2022. In 2021, there was a significant increase in death records with 42.5 percent, after the pandemic hit the country. (Figures 1 and 2)
Figure 1. Number of Registered Deaths, MIMAROPA: 2011 – 2022
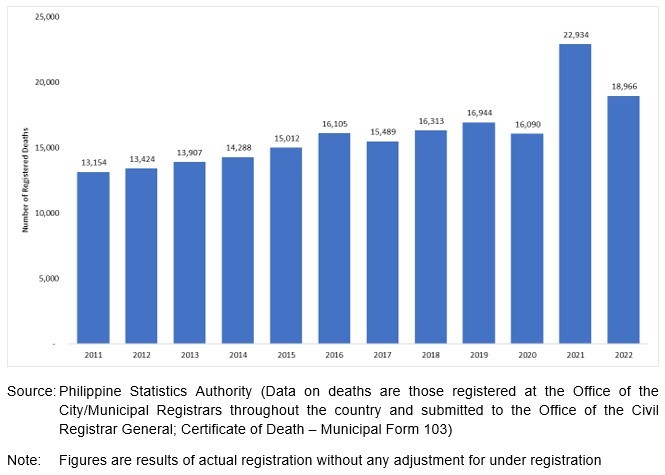
Figure 2. Percentage Change of Registered Deaths,
MIMAROPA: 2012 – 2022
Highest number of deaths recorded in Oriental Mindoro
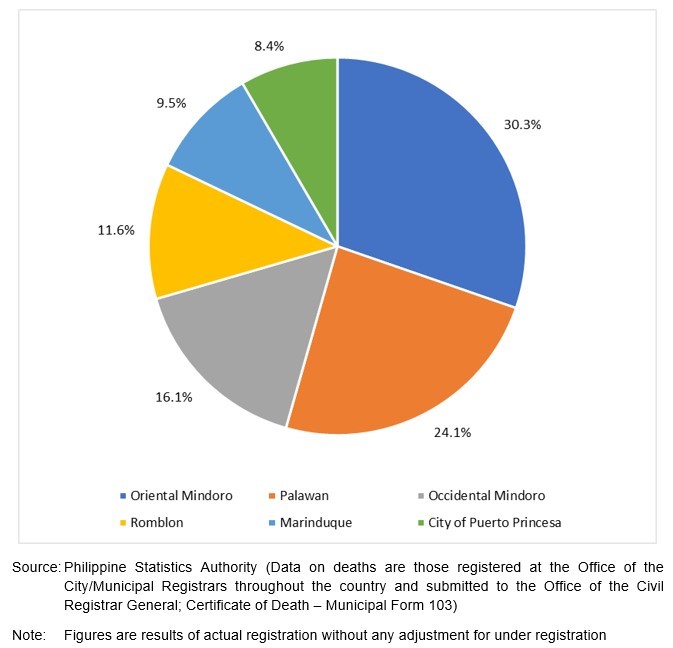
The top three provinces in terms of number of registered deaths by usual residence were Oriental Mindoro with 5,745 deaths (30.3 percent share), Palawan with 4,579 (24.1 percent share), and Occidental Mindoro with 3,057 (16.1 percent share). The combined share of these three provinces was 70.6 percent of the total registered deaths in 2022.
On the other hand, the least number of registered deaths occurred in City of Puerto Princesa with 1,589 registered deaths (8.4 percent share) and in Marinduque with 1,802 deaths or 9.5 percent share.
Figure 3. Percent Distribution of Registered Deaths by Usual Residence,
MIMAROPA: 2022
Top ten City/Municipalities with the highest number of deaths
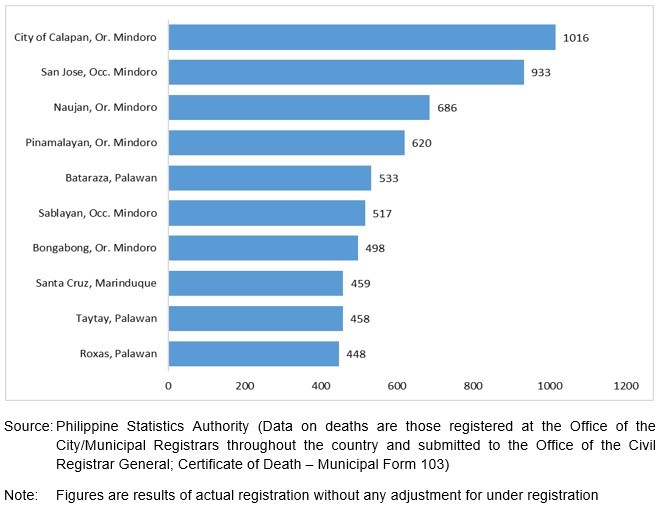
Out of the 72 city/municipalities in the MIMAROPA region, the City of Calapan located in Oriental Mindoro registered 1,016 deaths or 5.4 percent share, followed by San Jose in Occidental Mindoro with 933 registered deaths or 4.9 percent share of the total registered deaths in 2022. Followed by Naujan, Oriental Mindoro with 686 deaths(3.6 percent share), Pinamalayan, Oriental Mindoro with 620 deaths(3.3 percent share), Bataraza, Palawan with 533 deaths or 2.8 percent share, Sablayan, Occidental Mindoro with 517 deaths or 2.7 percent share, Bongabong, Oriental Mindoro with 498 deaths or 2.6 percent share, Santa Cruz, Marinduque with 459 deaths or 2.4 percent share, Taytay, Palawan with 458 deaths or 2.4 percent share, and Roxas, Palawan with 448 deaths or 2.4 percent share. These ten city/municipalities collectively share almost one-third (32.5 percent share) of the total registered deaths in the region. Further, in the top ten city/municipalities with highest number of marriages, four came from Oriental Mindoro, three from Palawan, two from the province of Occidental Mindoro, and one from Marinduque. (Figure 4)
Figure 4. Top Ten City/Municipalities with Most Number of Registered
Deaths, MIMAROPA: 2022
January had the highest number of deaths
In 2022, January had the highest number of recorded deaths with 1,887, followed by November with 1,696 registered deaths, and then by April with 1,676 registered deaths. The months of July and September had the lowest number of deaths recorded with 1,423, each.(Figure 5)
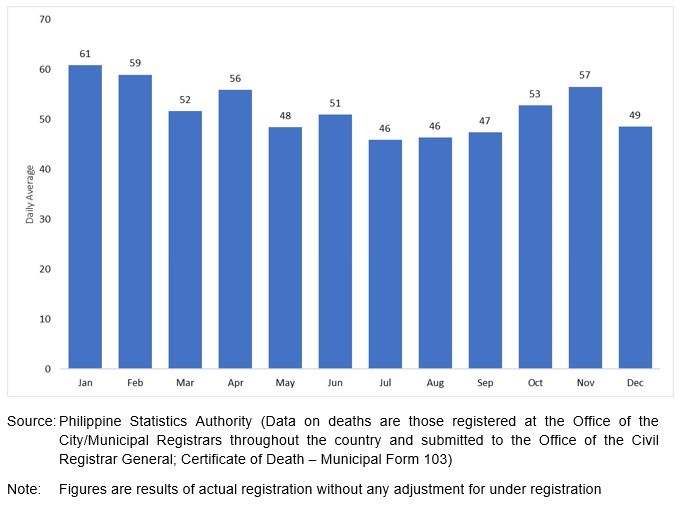
In terms of daily average, January recorded the highest with 61 deaths per day or three deaths per hour, followed by February with 59 deaths per day and then by November with 57 deaths per day.
On the other hand, months of July and August marked the least daily average number of deaths per day with 46, each. (Figure 6)
Daily index refers to the increase or decrease from the overall daily average of event occurrences. In 2022, the months of March, May, June, July, August, September, and December fall below the regional level index of 100. In other words, daily average deaths in these months were lower than the regional daily average of 52 deaths.
Figure 5. Number of Registered Deaths by Month of Occurrence,
MIMAROPA: 2022
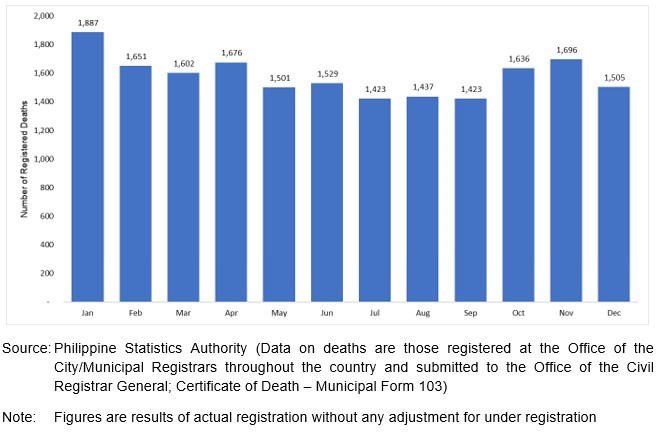
Figure 6. Daily Average of Registered Deaths by Month of Occurrence,
MIMAROPA: 2022
More male deaths than female deaths registered
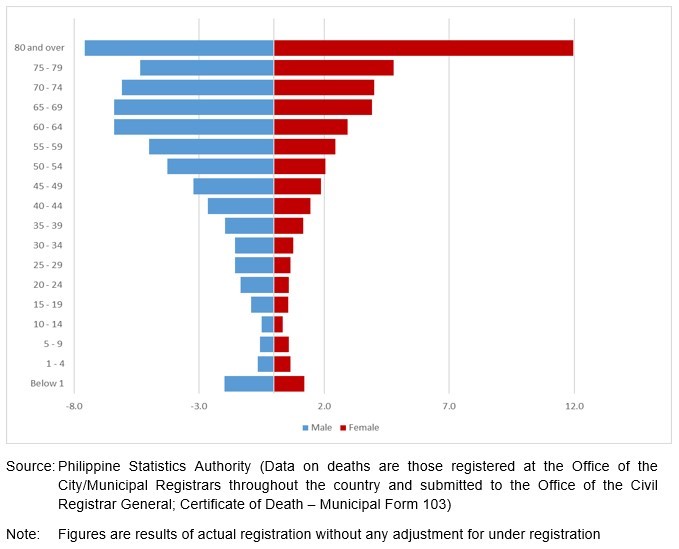
Figure 7 illustrates the age-sex structures of registered deaths in 2022. It depicts an inverted pyramid, with fewer deaths at younger ages, except for children under one, and a gradual increase as people grow older. In the MIMAROPA Region, the number of male deaths (11,006 or 58.0 percent share) exceeded female deaths (7,960 or 42.0 percent share).
The proportion of males who died is observed to be highest in the oldest age group, 80 years old and over (1,435 or 13.0 percent of male deaths) while for females, the highest was seen also at the oldest age group, 80 years old and over (2,269 or 28.5 percent in female deaths).
The next highest number of registered deaths in males is found in the 65 to 69 years old age group, accounting for 1,215 or 11.0 percent of male deaths. This is followed by the 60-64 years old age group with 1,214 or 11.0 percent of male deaths, and then the 70 to 74 years old age group with 1,153 or 10.5 percent of male deaths.
In females, the next highest number of registered deaths is observed in the 75 to 79 years old age group, tallied at 905 or 11.4 percent of female deaths. This is followed by the 70-74 years old age group with 759 or 9.5 percent of female deaths, and then the 65 to 69 years old age group with 742 or 9.3 percent of male deaths. It is also worthwhile to mention that both male and female progressively increase the number of registered deaths starting the age of 40 to 45 years old.
Deaths in males in adolescent age belonging to age group 10 to 14 years old and 15 to 19 years old is also higher than females of the same age group. Males in adolescent age recorded deaths accounting for 270 or 2.5 percent in male deaths while females registered 171 deaths or 2.1 percent female deaths in the same age group.
The sex ratio was computed at 138. This means that there were about 138 male deaths for every 100 females. Moreover, a sex ratio of over a hundred indicates that more male deaths were registered compared to their female counterparts at each age group before 80 years old.
Figure 7. Percent Share of Deaths by Age Group and Sex,
MIMAROPA: 2022
(SGD) LENI R. RIOFLORIDO
Regional Director
MLLM/OHG/CRC

