

Release Date :
Reference Number :
2023-22
City of Puerto Princesa
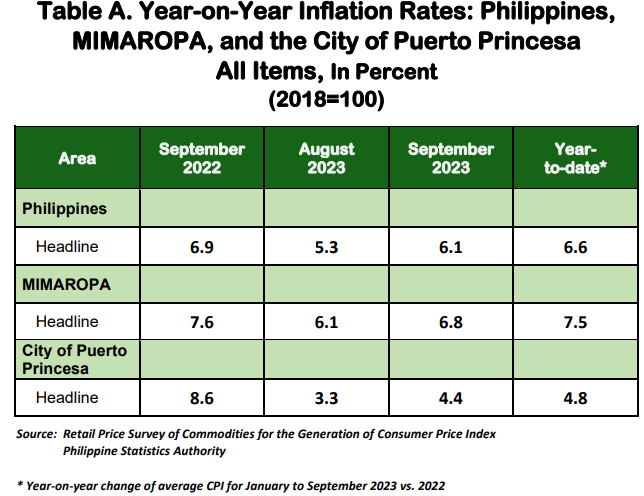
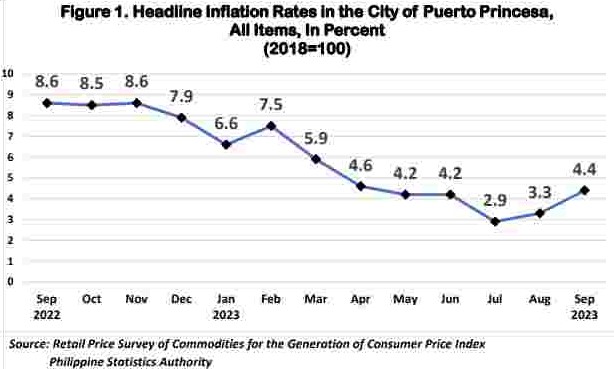
The headline inflation in the City of Puerto Princesa for September 2023 rose to 4.4 percent from 3.3 percent in August 2023. In September 2022, the headline inflation was higher, at 8.6 percent. The average inflation rate for the first nine months of the year stood at 4.8 percent, (Table A and Figure 1).
The main drivers to the faster growth rate of the city are the higher inflation for the indices of Housing, Water, Electricity, Gas and Other Fuels at 3.8 percent, from 0.9 in the previous month. This was followed by Food and Non- Alcoholic Beverages at 3.6 percent, from 2.4 percent in August 2023.
Furthermore, higher indices were also observed in the following commodities:
- Information and Communication, -0.1 percent from -1.0 percent;
- Health, 3.5 percent from 2.7 percent; and
- Transport, 2.1 percent from 1.9 percent.
In contrast, commodities that decelerated for the month of September are the following:
- Restaurants and Accommodation Services, 9.6 percent from 11.2 percent;
- Clothing and Footwear, 5.0 percent from 5.7 percent;
- Personal Care, Miscellaneous Good and Services, 6.2 percent from 6.3 percent;
- Alcoholic Beverages and Tobacco, 11.9 percent from 13.0 percent; and
- Recreation Sport and Culture, 7.9 percent from 8.7 percent.
Meanwhile, commodities which remained at their previous annual rates are:
- Furnishings, Household Equipment and Routine Household Maintenance, 6.7 percent;
- Education Services, 0.4 percent; and
- Financial Services, 0.0 percent.
Table B. Year-on-Year Inflation Rates in the City of Puerto Princesa,
All Items, In Percent (2018=100)
| Commodity Group | Inflation Rates | ||
| Sep '22 | Aug '23 | Sep '23 | |
| Food and Non-alcoholic Beverages | 12.7 | 2.4 | 3.6 |
| Alcoholic Beverages and Tobacco | 11.5 | 13.0 | 11.9 |
| Clothing and Footwear | 11.0 | 5.7 | 5.0 |
| Housing, Water, Electricity, Gas and other Fuels | 2.5 | 0.9 | 3.8 |
| Furnishings, Household Equipment and Routing Household Maintenance | 5.9 | 6.7 | 6.7 |
| Health | 3.1 | 2.7 | 3.5 |
| Transport | 14.5 | 1.9 | 2.1 |
| Information and Communication | 1.8 | (1.0) | (0.1) |
| Recreation, Sport ,and Culture | 7.5 | 8.7 | 7.9 |
| Education Services | 0.0 | 0.4 | 0.4 |
| Restaurants and Accommodation Services | 7.6 | 11.2 | 9.6 |
| Financial Services | 0.0 | 0.0 | 0.0 |
| Personal Care, and Miscellaneous Goods and Services | 6.8 | 6.3 | 6.2 |
Food inflation in September 2023 moved at a faster pace of 3.3 percent from 1.8 percent in the previous month. In September 2022, the food index was higher at 13.3 percent inflation rate, (Table C).
The main drivers for the uptrend in food inflation were Rice at 1.5 percent, from -3.6 percent in August 2023. This was followed by Fish and Other Seafood at 1.1 percent from -0.1 percent. The third main driver is Fruits and Nuts at 7.5 percent from 3.2 percent in the previous month. Furthermore, higher indices were also observed in the following commodities:
- Sugar, Confectionery and Desserts, 11.3 percent from 9.8 percent;
- Milk, Other Dairy Products and Eggs, 7.2 percent from 6.8 percent;
- Meat and Other Parts of Slaughtered Land Animals, -1.3 percent from -1.4 percent;
- Ready-made Food and Other Food Products n.e.c., 3.6 percent from 3.4 percent; and
- Corn, 11.7 percent from 3.6 percent.
Meanwhile, lower annual growth rates were observed in the following commodities:
Vegetables, Tubers, Plantains, Cooking Bananas and Pulses, 14.2 percent, from 15.7 percent;
Flour, Bread and Other Bakery Products, Pasta Products, and Other Cereals, 3.7 percent from 5.3 percent; and
Oils and Fats, -6.4 percent from -3.5 percent.
Table C. Year-on-Year Inflation Rates in the City of Puerto Princesa,
By Food Group, In Percent (2018=100)
Food Commodity Group | Inflation Rates | ||
Sep '22 | Aug '23 | Sep '23 | |
Food | 13.3 | 1.8 | 3.3 |
Cereals and cereal products | 6.8 | (1.3) | 2.2 |
Cereals | 4.7 | (3.5) | 1.6 |
Rice | 4.9 | (3.6) | 1.5 |
Corn | (1.7) | 3.6 | 11.7 |
Flour, Bread and other Bakery Products, Pasta Products and other Cereals | 13.4 | 5.3 | 3.7 |
Meat and Other Parts of Slaughtered Land Animals | 23.9 | (1.4) | (1.3) |
Fish and other seafood | 20.0 | (0.1) | 1.1 |
Milk, Other Dairy Products andEggs | 7.7 | 6.8 | 7.2 |
Oils and Fats | 17.6 | (3.5) | (6.4) |
Fruits and Nuts | 13.1 | 3.2 | 7.5 |
Vegetables, Tubers, Plantains, Cooking Bananas and Pulses | 9.2 | 15.7 | 14.2 |
Sugar, Confectionery, and Desserts | 31.6 | 9.8 | 11.3 |
Ready-made Food and Other Food Products n.e.c. | 8.6 | 3.4 | 3.6 |
Table D. Year-on-Year Inflation Rates in the City of Puerto Princesa, All Items, In Percent
January 2020 – September2023
(2018=100)
Month | Inflation Rate | |||
2020 | 2021 | 2022 | 2023 | |
January | 1.0 | 3.8 | 4.1 | 6.6 |
February | 0.9 | 3.6 | 4.1 | 7.5 |
March | 0.4 | 4.2 | 5.2 | 5.9 |
April | 0.4 | 4.3 | 5.7 | 4.6 |
May | 1.9 | 2.6 | 7.3 | 4.2 |
June | 2.8 | 1.7 | 7.7 | 4.2 |
July | 3.0 | 1.3 | 9.3 | 2.9 |
August | 3.0 | 1.3 | 9.2 | 3.3 |
September | 3.2 | 0.8 | 8.6 | 4.4 |
October | 3.0 | 1.2 | 8.5 |
|
November | 3.8 | 1.7 | 8.6 |
|
December | 4.1 | 1.8 | 7.9 |
|
|
|
|
|
|
Average | 2.3 | 2.4 | 7.2 |
|

| Attachment | Size |
|---|---|
|
|
333.72 KB |