

Release Date :
Reference Number :
2022-025
Table A. Year-on-Year Inflation Rates: Philippines, MIMAROPA, and the City of Puerto Princesa All Items, In Percent (2018=100)
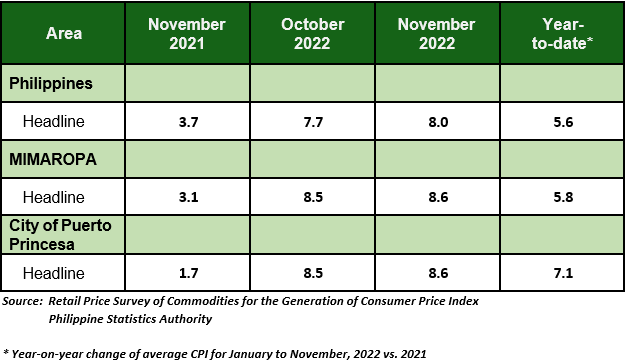
City of Puerto Princesa
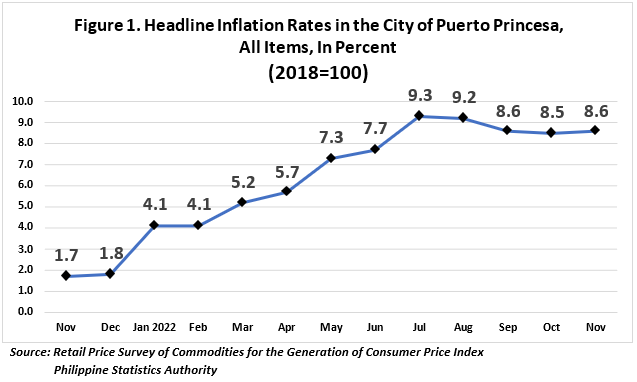
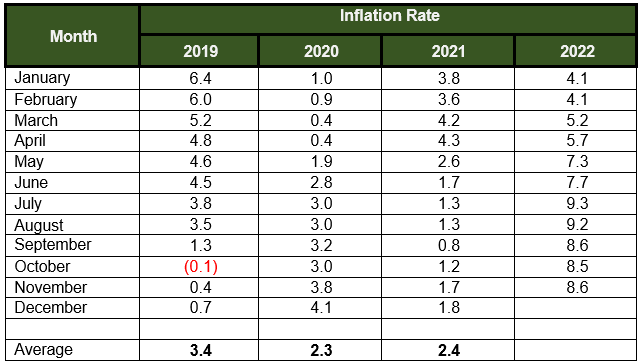
The headline inflation in the City of Puerto Princesa exhibited an uptrend as it moved to 8.6 percent in November 2022, from 8.5 percent in October 2022. The average inflation for the year’s first eleven months stood at 7.1 percent. (Table A and Figure 1)
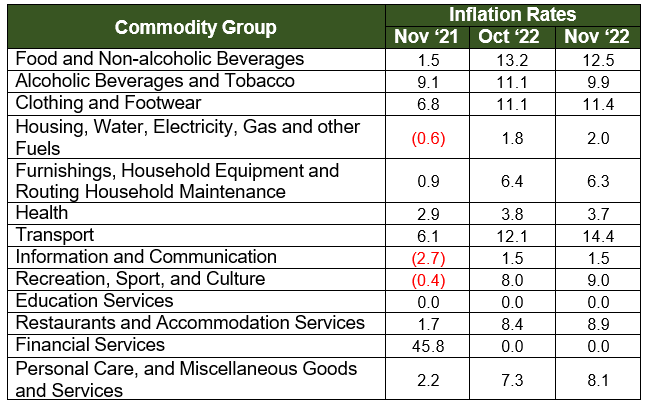
The renewed uptrend was attributed to the higher annual increment in the index for transport at 14.4 percent, from 12.1 percent in October 2022. Contributing to the uptrend was also observed in Housing, Water, Electricity, Gas, and other fuels at 2.0 percent, and Restaurants and Accommodation services at 8.9 percent (Table B). Furthermore, higher indices were also observed in the following commodity groups:
a. Personal care and miscellaneous good and services, 8.1 percent
b. Clothing and footwear, at 11.4 percent,
c. Recreation, sport, and culture, 9.0 percent
On the other hand, the rest of the commodity groups either retained their previous month’s inflation rates or registered lower price indices during the month.
Table B. Year-on-Year Inflation Rates in City of Puerto Princesa, All Items, In Percent (2018=100)
Food index for November 2022 was posted at 12.8 percent, lower than its previous month’s value of 13.7 percent. In November 2021, the food index was lower, at 1.4 percent (Table C).
During this period, major contributors to the downtrend in the food index are Meat and other parts of slaughtered land animals at 17.9 percent followed by Oils and fats at 14.2 percent. Other contributors to the decrease in the food index are Rice at 4.5 percent; and Fruits and Nuts, at 20.2 percent. Meanwhile, Corn further declined from -4.0 percent in October 2022 to -5.0 percent.
On the other hand, the following food commodity groups exhibited an increase in inflation rates:
a. Sugar, confectionery, and desserts, 40.3 percent
b. Flour, Bread and other Bakery Products, Pasta Products and other Cereals, 14.1 percent
c. Vegetables, tubers, plantains, cooking bananas and pulses, 12.4 percent
d. Ready-made food and other food products n.e.c., 9.2 percent
Table C. Year-on-Year Inflation Rates in City of Puerto Princesa, By Food Group, In Percent (2018=100)
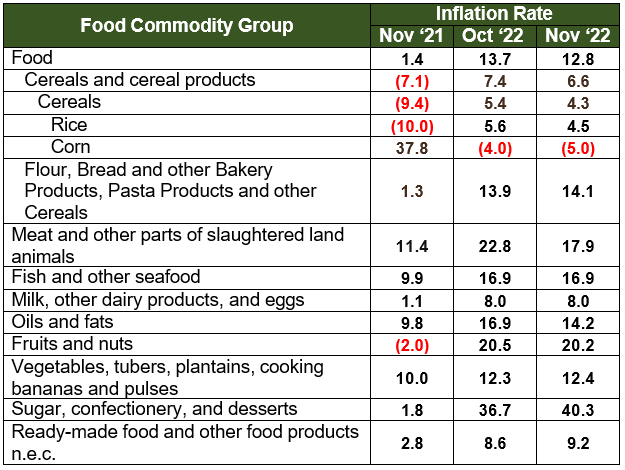
Table D. Year-on-Year Inflation Rates in City of Puerto Princesa, All Items, In Percent January 2019 – November 2022 (2018=100)

| Attachment | Size |
|---|---|
|
|
437.14 KB |