

Release Date :
Reference Number :
2023-19
Palawan
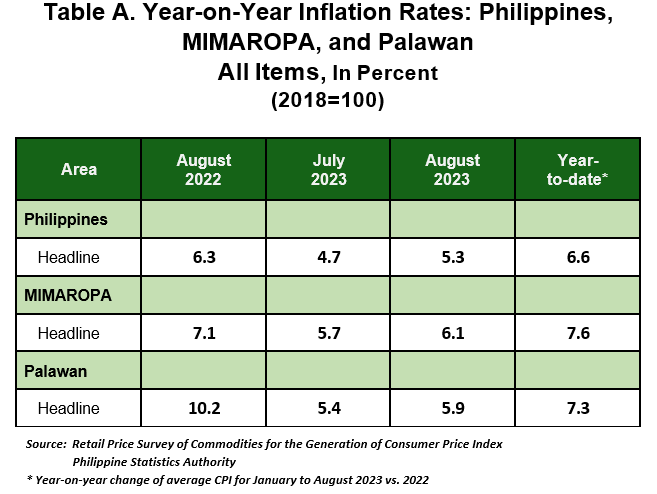
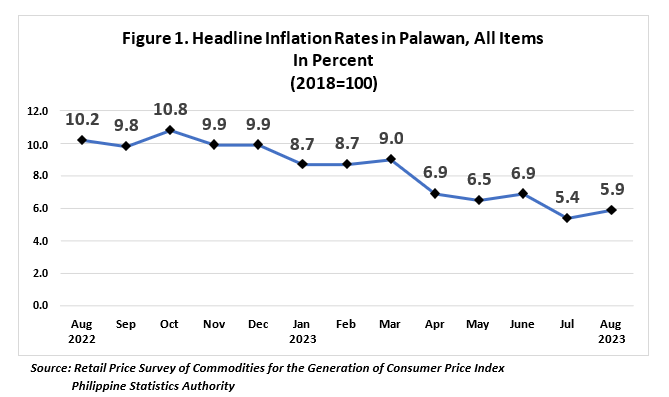
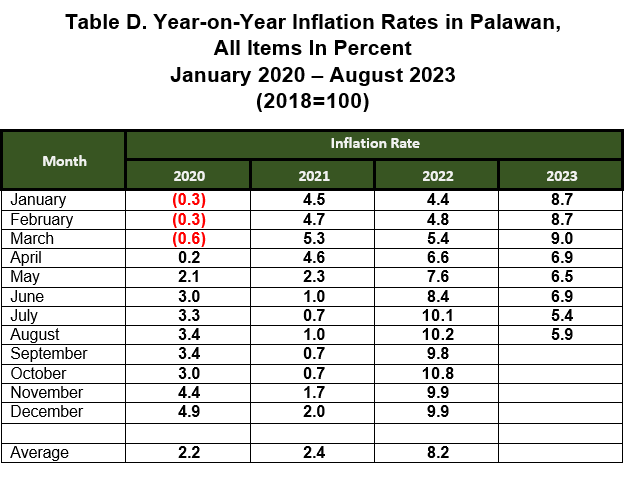
The headline inflation in the province of Palawan increased to 5.9 percent in August 2023, from 5.4 percent in July 2023. This brings the average inflation rate for the first eight (8) months of the year to 7.2 percent. In August 2022, inflation rate is higher at 10.2 percent, (Table A and Figure 1).
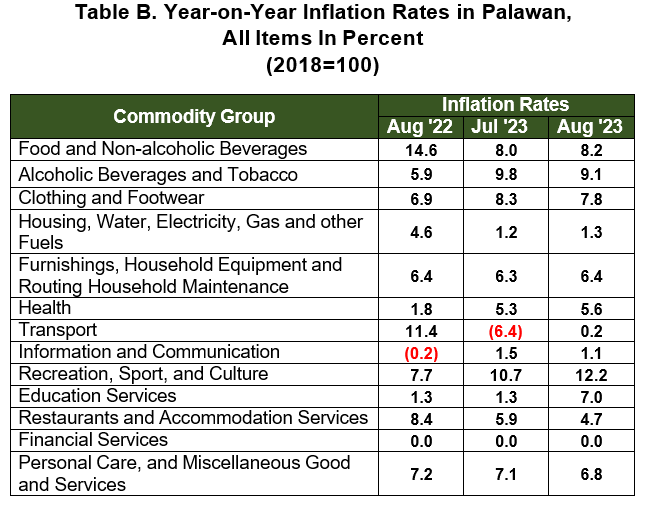
The uptrend in the provincial inflation in August 2023 was primarily influenced by the higher annual increment in the Transport index, which registered a 0.2 percent inflation rate, from -6.4 percent in July 2023. This was followed by Food and Non-Alcoholic Beverages, which posted an increase of 8.2 percent from 8.0 percent last month. The third driver to the acceleration was Education Services which registered a 7.0 percent inflation rate from 1.3 percent in the previous month.
In addition, uptrends were also observed in the indices of the following commodity groups:
a. Housing, Water, Electricity, Gas and other Fuels, 1.3 percent;
b. Recreation, Sport, and Culture, 12.2 percent;
c. Health, 5.6 percent; and
d. Furnishings, Household Equipment and Routing Household Maintenance, 6.4 percent.
On the other hand, lower increments were observed in the indices of the following commodities:
a. Restaurants and Accommodation Services, 4.7 percent;
b. Clothing and Footwear, 7.8 percent;
c. Personal Care and Miscellaneous Good and Services, 6.8 percent;
d. Alcoholic Beverages and Tobacco, 9.1 percent; and
e. Information and Communication, 1.1 percent.
Meanwhile, Financial Services retained its previous month’s inflation rate of
0.0 percent.
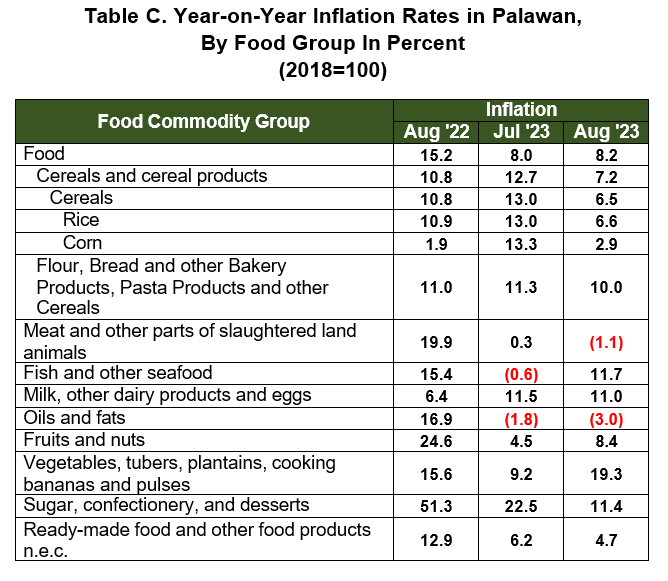
Food index for August 2023 accelerated to 8.2 percent inflation rate, from
8.0 percent in the previous month. In August 2022, the food index was higher, at 15.2 percent inflation rate, (Table C).
The acceleration of food inflation in August 2023 was brought about by higher increments in the indices of Fish and Other Seafood at 11.7 percent
rate, from -0.6 percent last month. This was followed by Vegetables, Tubers, Plantains, Cooking Bananas and Pulses with an annual increase of 19.3 percent inflation rate, from 9.2 percent in July 2023. Also contributing to the uptrend is Fruits and Nuts which increased to 8.4 percent inflation rate, from 4.5 percent in the previous month.
Meanwhile, lower indices were observed in the following commodities:
a. Rice, 6.6 percent;
b. Meat and Other Parts of Slaughtered Land Animals, -1.1 percent;
c. Flour, Bread and other Bakery Products, Pasta Products and other Cereals, 10.0 percent;
d. Milk, Other Dairy Products and Eggs, 11.0 percent;
e. Ready-made food and other food products n.e.c., 4.7 percent;
f. Sugar, confectionery, and desserts, 11.4 percent;
g. Oils and Fats, -3.0 percent; and
h. Corn, 2.9 percent.
| Attachment | Size |
|---|---|
|
|
428 KB |