

Release Date :
Reference Number :
2023-07
Palawan
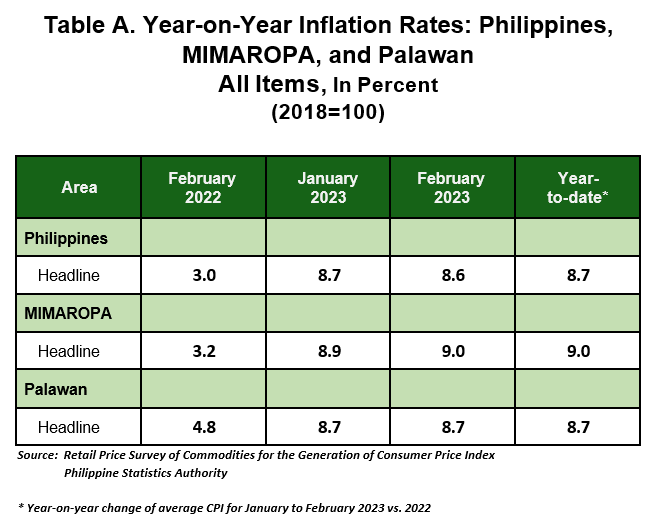
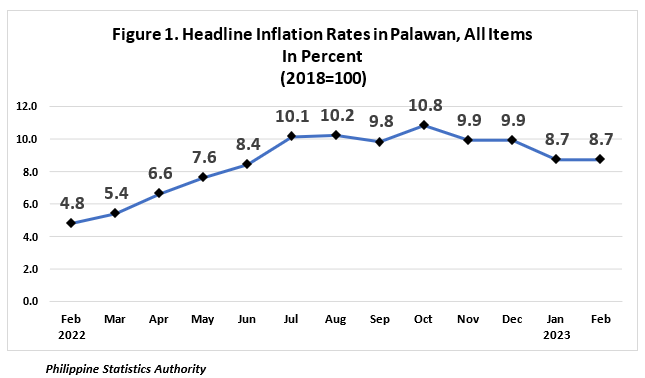
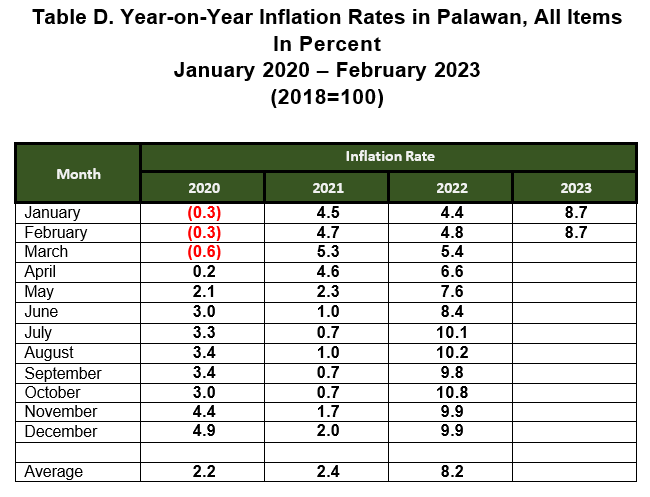
The headline inflation for the province of Palawan remained at 8.7 percent for February 2023, the same growth rate observed in January 2023. In February 2022, inflation rate is lower at 4.8 percent. The average inflation rate forthe first two months of the year stood at 8.7 percent,(Table A and Figure 1).
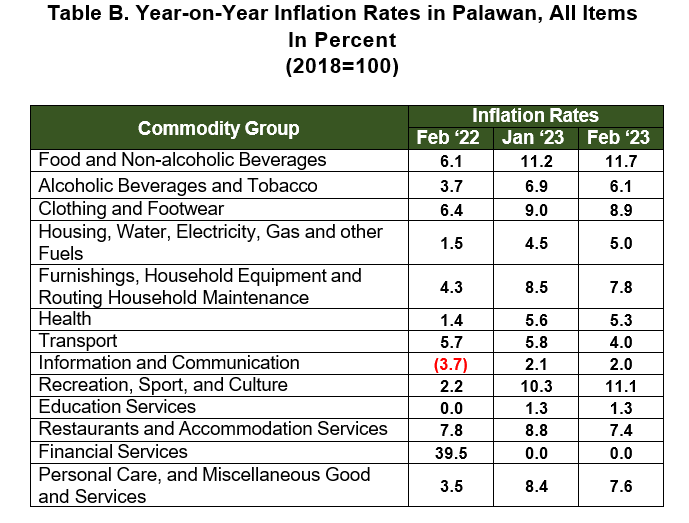
The main contributors for the inflationrate in the month of February are higher indices in Food and Non-Alcoholic Beverages at 11.7 percent, from 11.2 percent in January 2023. This is followed by Housing, Water, Electricity, Gas and Other Fuels at 5.0 percent, from 4.5 percent in the previous month. In addition, higher growth rate was also observed in Recreation, Sport and Culture at 11.1 percent from 10.3 percent.
On the other hand, downtrends were observed in the indices of the following commodities:
a. Clothing and Footwear, 8.9 percent;
b. Restaurants and Accommodation Services, 7.4 percent;
c. Personal Care, and Miscellaneous Good and Services, 7.6 percent;
d. Transport, 4.0 percent;
e. Furnishings, Household Equipment and Routine Household Maintenance, 7.8 percent;
f. Alcoholic Beverages and Tobacco, 6.1 percent;
g. Health, 5.3 percent; and
h. Information and Communication, 2.0 percent.
The rest of the other commodity groups retained their previous months’ inflation rates.
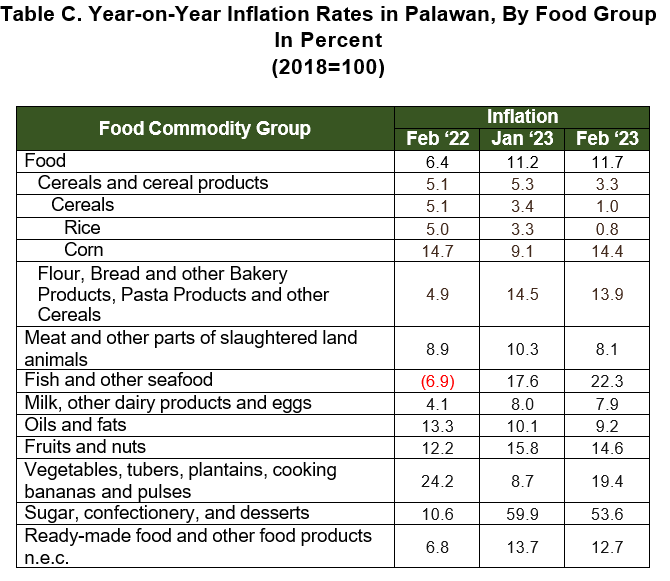
Food index in February 2023 accelerated to 11.7 percent, from 11.2 percent in the previous month. In February 2022, the food index was lower, at 6.4 percent, (Table C).
During this period, major contributors to the uptrend in the food index were Vegetables, Tubers, Plantains, Cooking Bananas and Pulses at 19.4 percent, Fish and Other Seafood at 22.3 percent, and Corn at 14.4 percent.
On the other hand, lower indices were observed in the following commodities:
a. Sugar, Confectionery and Desserts, 53.6 percent;
b. Meat and Other Parts of Slaughtered Land Animals, 8.1 percent;
c. Flour, Bread and other Bakery Products, Pasta Products and other Cereals, 13.9 percent;
d. Fruits and Nuts, 14.6 percent;
e. Ready-made Food and Other Food Products n.e.c., 12.7 percent;
f. Milk, Other Dairy Products and Eggs, 7.9 percent;
g. Rice, 0.8 percent; and
h. Oils and Fats, 9.2 percent.

| Attachment | Size |
|---|---|
|
|
419.96 KB |