

Release Date :
Reference Number :
2023-15
Palawan
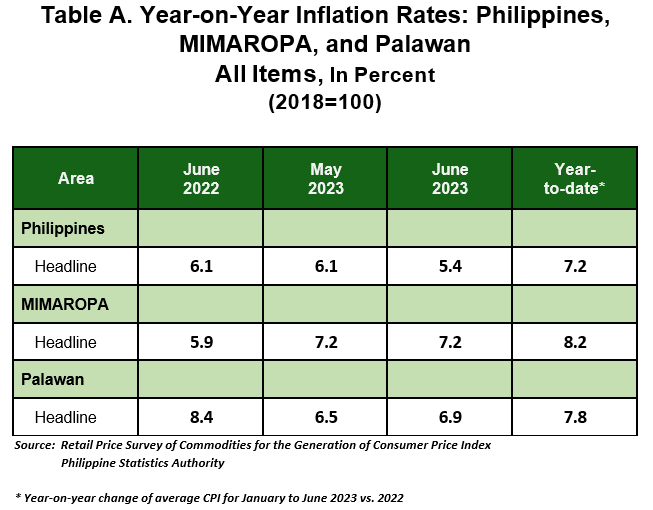
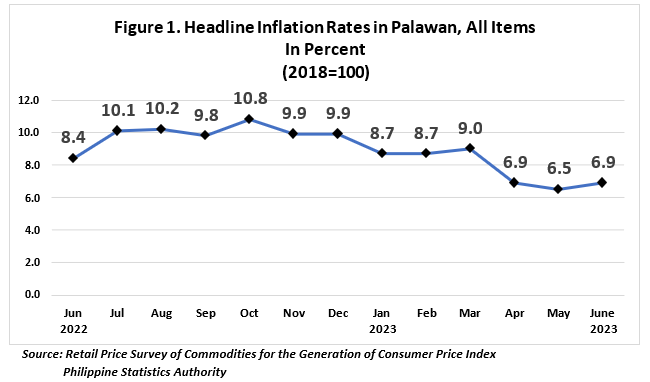
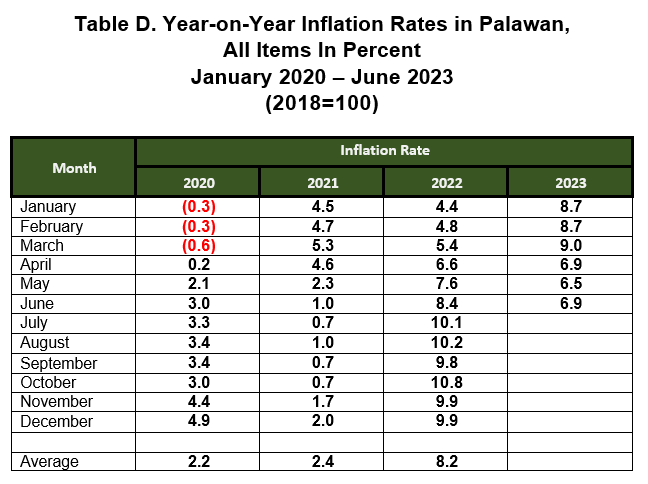
The headline inflation in the province of Palawan registered a moderate uptick of 6.9 percent in June 2023, from 6.5 percent in May 2023. In June 2022, inflation rate is higher at 8.4 percent. The average inflation rate for the first semester of the year stood at 7.8 percent, (Table A and Figure 1).
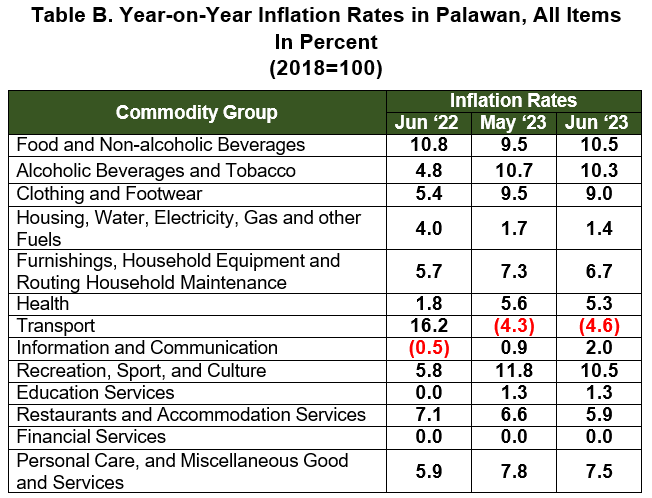
The increase in the provincial inflation in June 2023 is primarily influenced by the higher inflation of the heavily weighted Food and Non-Alcoholic Beverages which posted a 10.5 percent inflation rate, from 9.5 percent in May 2023. Information and Communication also contributed to the slight uptick which posted a 2.0 percent inflation rate, from 0.9 percent last month.
On the other hand, downtrends were observed in the indicesof the following commodity groups:
Housing, Water, Electricity, Gas and Other Fuels, 1.4 percent;
Transport, -4.6 percent;
Restaurants and Accommodation Services,5.9 percent;
Clothing and Footwear,9.0 percent;
- Personal Care and Miscellaneous Good and Services, 7.5 percent;
- Furnishings, Household Equipment and Routine Household Maintenance, 6.7 percent;
- Health, 5.3 percent;
- Alcoholic Beverages and Tobacco, 10.3 percent; and
- Recreation, Sport and Culture, 10.5 percent.
Meanwhile, Education and Financial Servicesretained their previousmonth’s inflation rates of 1.3 percent and 0.0 percent, respectively.
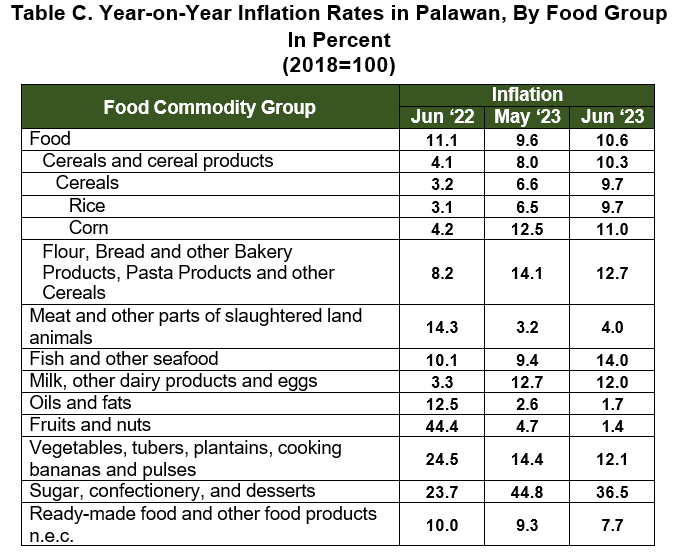
Food index for June 2023 showed an upward movement registering a 10.6 percent inflation rate, from 9.6 percent in the previous month. In June 2022, the food index was higher, at 11.1 percent inflation rate, (Table C).
The acceleration of food inflation was brought about by higher increments in the indices of Rice at 9.7 percent, followed by Fish and Other Seafood at 14.0 percent, from 6.5 percent and 9.4 percent, respectively in May 2023.
Also contributing to the uptrendis Meat and Other Parts of Slaughtered Land Animals at 4.0 percent, from 3.2 percent last month.
Meanwhile, lowerinflation rates were observed in the following commodities:
Vegetables, Tubers, Plantains, Cooking Bananasand Pulses, 12.1
percent;Flour, Bread and otherBakery Products, Pasta Products and other Cereals, 12.7 percent;
Milk, Other Dairy Products and Eggs, 12.0 percent;
Fruits and Nuts, 1.4 percent;
Ready-made food and Other Food Products n.e.c., 7.7 percent;
Sugar, Confectionery and Desserts, 36.5 percent;
Oils and Fats, 1.7 percent; and
Corn, 11.0 percent.

| Attachment | Size |
|---|---|
|
|
511.24 KB |