

Release Date :
Reference Number :
2023-13
Palawan
The headline inflation in the province of Palawan continued to slow down at
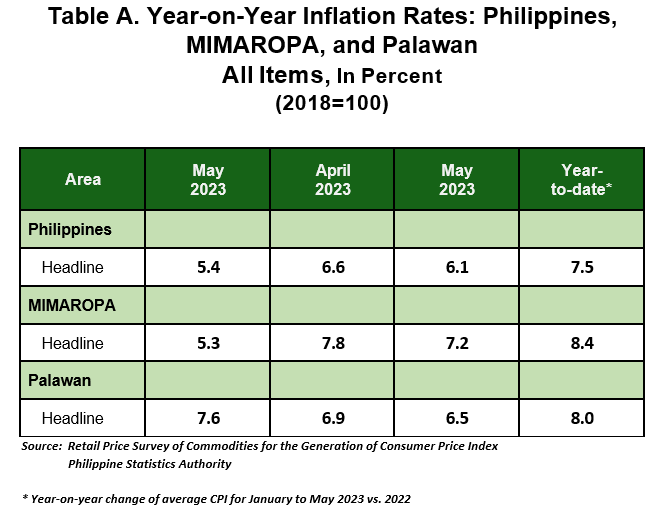
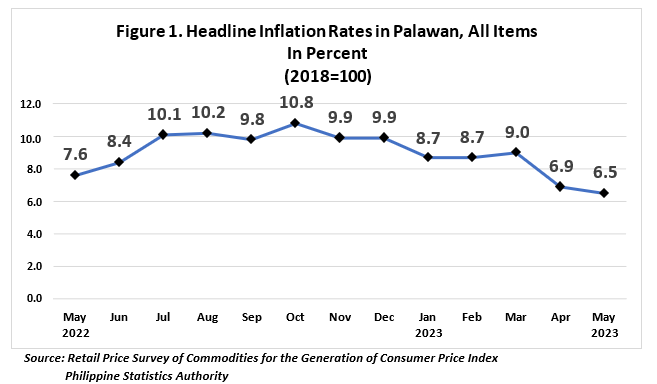
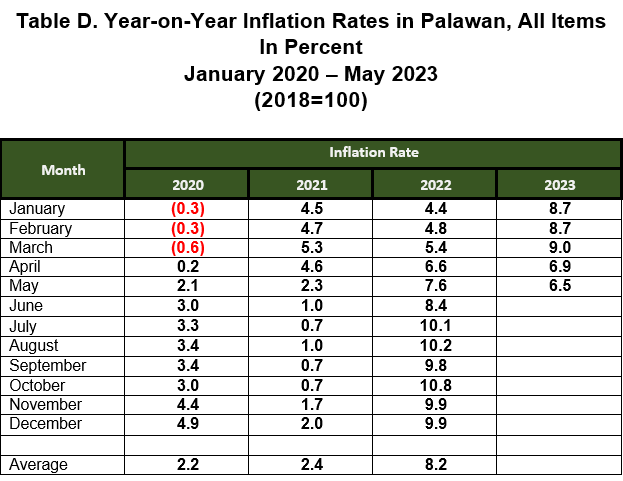
6.5 percent in May 2023, from 6.9 percent in April 2023. In May 2022, inflation rate is higher at 7.6 percent. The average inflation rate for the first five months of the year stood at 8.0 percent, (Table A and Figure 1).
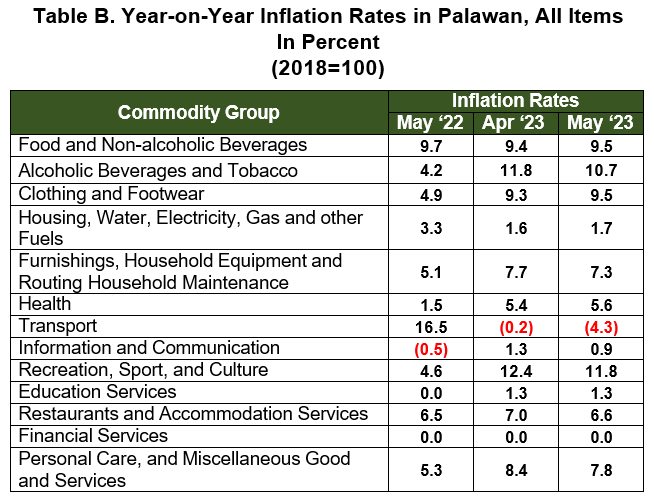
The slowdown in the provincial inflation in May 2023 was primarily driven by the lower index in Transport at -4.3 percent, from -0.2 percent in April 2023. Personal Care, Miscellaneous Good and Services also pulled down the overall inflation with a lower inflation rate of 7.8 percent, from 8.4 percent last month. The third driver on the slowdown was Alcoholic Beverages and Tobaccowhich posted a 10.7 percent inflation rate from 11.8 percent last April 2023.
Moreover, downtrends were also observedin the indices of the following commodity groups:
Restaurants and Accommodation Services, 6.6 percent;
Furnishings, Household Equipment and Routine Household Maintenance, 7.3 percent;
Information and Communication, 0.9 percent; and
Recreation, Sport and Culture, 11.8 percent.
On the contrary, uptrends were notedin the indicesof the following commodity groups:
Food and Non-Alcoholic Beverages, 9.5 percent;
Clothing and Footwear,9.5 percent;
Housing, Water,Electricity, Gas and Other Fuels,1.7 percent; and
Health, 5.6 percent.
Meanwhile, Education and Financial Servicesretained their previousmonth’s inflation rates of 1.3 percent and 0.0 percent, respectively.
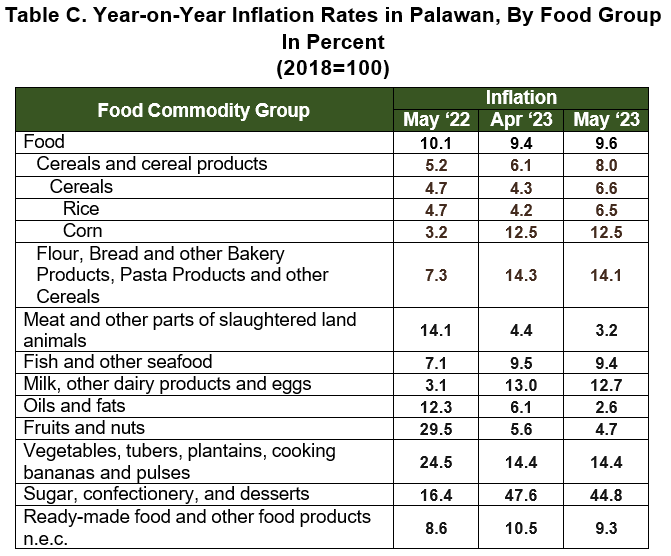
Food index for May 2023 exhibited higher growth rate which posted a 9.6 percent inflation, from 9.4 percent in the previous month. In May 2022, the food index was higher, at 10.1 percent inflation rate, (Table C).
Rice was the sole driver for the higher food inflationat 6.5 percent, from 4.2
Lower inflation rates were observedin the following commodities:
- Fish and Other Seafood, 9.4 percent;
- Sugar, Confectionery and Desserts, 44.8 percent;
- Flour, Bread and other BakeryProducts, Pasta Products and other Cereals, 14.1 percent;
- Milk and Other Dairy Products and Eggs, 12.7 percent;
- Meat and Other Partsof Slaughtered Land Animals, 3.2 percent;
- Ready-made food and Other Food Products n.e.c., 9.3 percent;
- Fruits and Nuts, 4.7 percent; and
- Oils and Fats, 2.6 percent.
Meanwhile, Corn and Vegetables, Tubers, Plantains, Cooking Bananas and Pulses retained their previous months inflation of 12.5 and 14.1 percent, respectively.

| Attachment | Size |
|---|---|
|
|
442.27 KB |