

Release Date :
Reference Number :
2023-17
Palawan
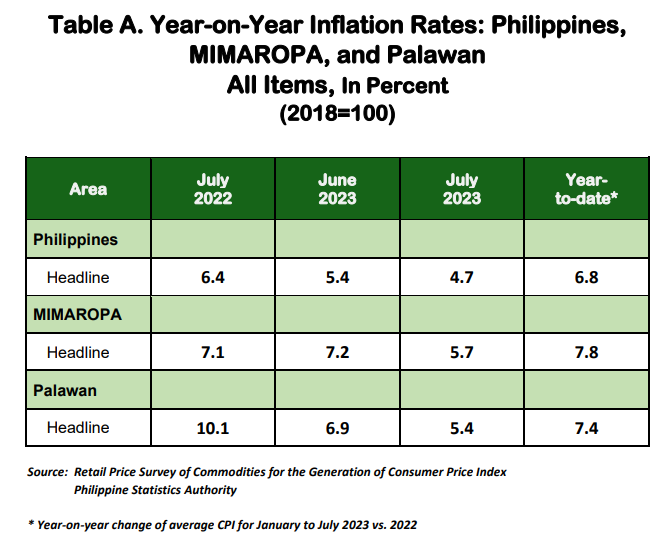
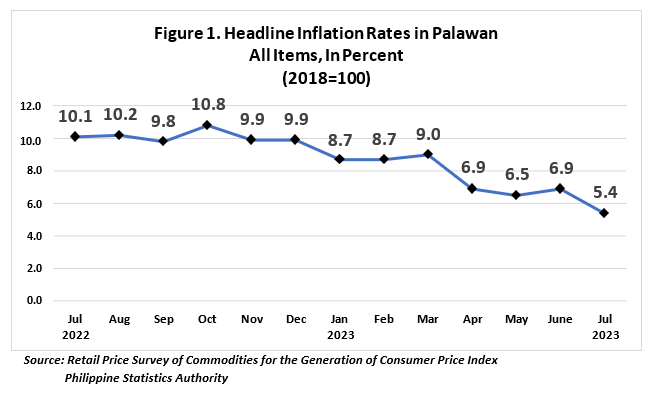
The headline inflation in the province of Palawan dipped to 5.4 percent in July 2023, from 6.9 percent in June 2023. In July 2022, inflation rate is higher at 10.1 percent. The average inflation rate for the first seven months of the year stood at 7.4 percent, (Table A and Figure 1).
The decline in the provincial inflation in July 2023 was driven primarily by the lower annual increment in the heavily-weighted Food and Non-Alcoholic Beverages, at 8.0 percent inflation rate, from 10.5 percent in June 2023. This was followed by Transport, which further declined to -6.4 percent inflation, from -4.6 percent in the previous month. The third driver to the slowdown was Housing, Water, Electricity, Gas and Other Fuels which posted a slight decline of 1.2 percent inflation from 1.4 percent last month.
In addition, downtrends were also observed in the indices of the following commodity groups:
a. Clothing and Footwear, 8.3 percent;
b. Personal Care and Miscellaneous Good and Services, 7.1 percent;
c. Furnishings, Household Equipment and Routine Household Maintenance, 6.3 percent;
d. Alcoholic Beverages and Tobacco, 9.8 percent; and
e. Information and Communication, 1.5 percent;
The rest of the commodity groups retained their previous month’s annual inflation rates with the exception of Recreation, Sport and Culture which exhibited an annual increment of 10.7 percent inflation rate, from 10.5 percent last month.

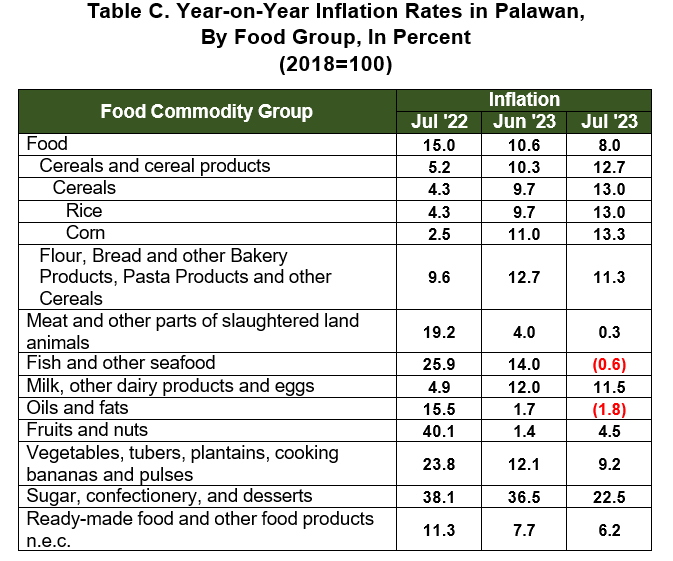
Food index for July 2023 slowed down to 8.0 percent inflation rate, from 10.6 percent in the previous month. In July 2022, the food index was higher, at 15.0 percent inflation rate, (Table C).
The deceleration of food inflation in July 2023 was brought about by lower increments in the indices of Fish and Other Seafood at -0.6 percent inflation, from 14.0 percent last month. This was followed by Sugar, Confectionery and Desserts with posted annual decline of 22.5 percent inflation, from 36.5 percent last June 2023.
Also contributing to the downtrend is Meat and Other Parts of Slaughtered Land Animals which registered a 0.3 percent inflation, from 4.0 percent in the previous month.
Also contributing to the downtrend are the following commodities:
a. Vegetables, Tubers, Plantains, Cooking Bananas and Pulses, 9.2
percent;
b. Flour, Bread and other Bakery Products, Pasta Products and other Cereals, 11.3 percent;
c. Oils and Fats, -1.8 percent;
d. Ready-made food and Other Food Products n.e.c., 6.2 percent; and
e. Milk, Other Dairy Products and Eggs, 11.5 percent;
Meanwhile, higher inflation rates were observed in Rice at 13.0 percent, Fruits and Nuts at 4.5 percent and Corn at 13.3 percent.

| Attachment | Size |
|---|---|
|
|
390.91 KB |