

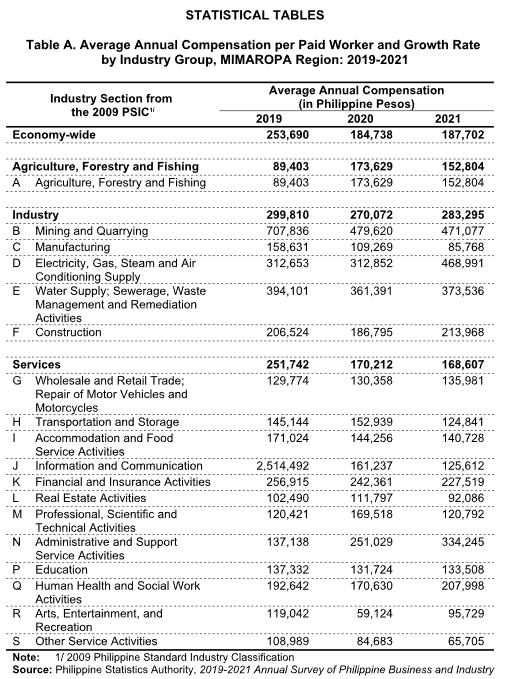
Industry sector workers received the highest annual compensation
By broad industry group, employees in the Industry sector received the highest
average annual pay of PhP 283,295 in 2021. This was followed by those employees
in the Services sector who received an average annual pay of PhP 168,607, while
employees in the Agriculture sector received an average annual compensation of
PhP 152,804. (Figure 2 and Table A)
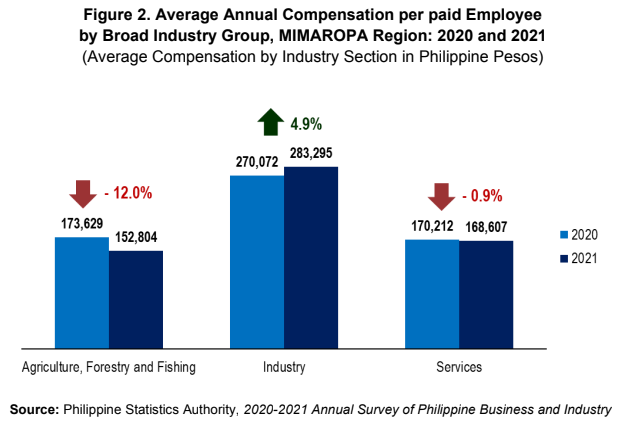
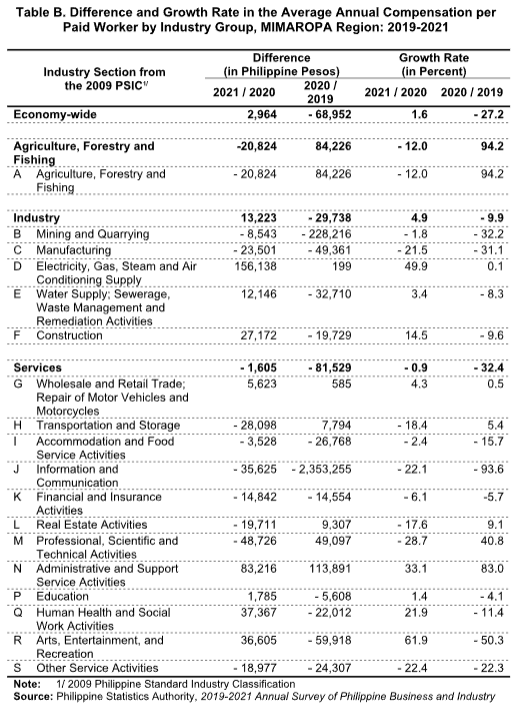
In terms of annual increase or decrease by broad industry group, the Industry sector
posted an increase of PhP 13,223 or an annual growth of 4.9 percent from the
average annual compensation of PhP 270,072 in 2020. On the other hand, the annual
average compensation paid by establishments under the Services went down by
PhP 1,605 or a negative growth of 0.9 percent compared to the compensation of
PhP 170,212 per paid workers in 2020. The average annual compensation in the
Agriculture sector also declined by PhP 20,824 or a negative growth of 12.0 percent
from PhP 173,629 in the previous year. (Figure 2 and Table B)
Mining and Quarrying paid workers received the highest annual compensation
Among 18 sections, employees in Mining and Quarrying received the highest average
annual pay of PhP 471,077. This was followed by employees in Electricity, Gas,
Steam and Air Conditioning Supply with an average pay of PhP 468,991 in a year, and
Water Supply; Sewerage, Waste Management and Remediation Activities with an
average annual pay of PhP 373,536 per paid employee. (Figure 3 and Table A)
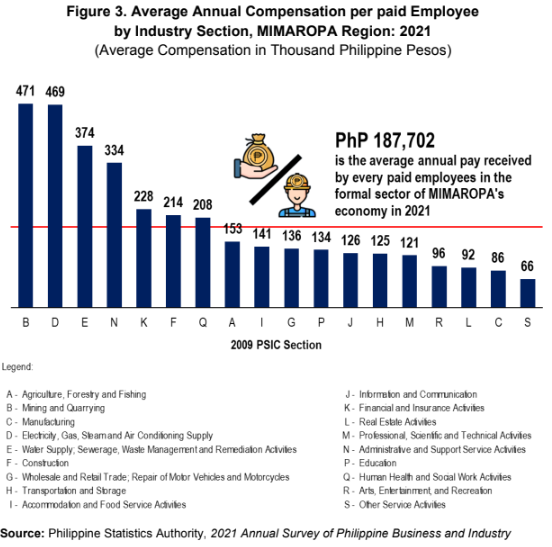
Other industries with average compensation higher than the regional average annual
compensation of PhP 187,702 in 2021 were the following: Administrative and Support
Service Activities at PhP 334,245 per paid worker, Financial and Insurance Activities
at PhP 227,519 per paid worker, Construction at PhP 213,968 per paid worker, and Human Health and Social Work Activities at PhP 207,998 per paid worker. (Figure 3
and Table A)
Meanwhile, employees in Other Service Activities had the lowest average annual pay
of PhP 65,705 in 2021. This was followed by the Manufacturing section with its
employees receiving an average annual compensation of PhP 85,768, and the Real
Estate Activities section with its workers receiving an average annual pay of
PhP 92,086. (Figure 3 and Table A)
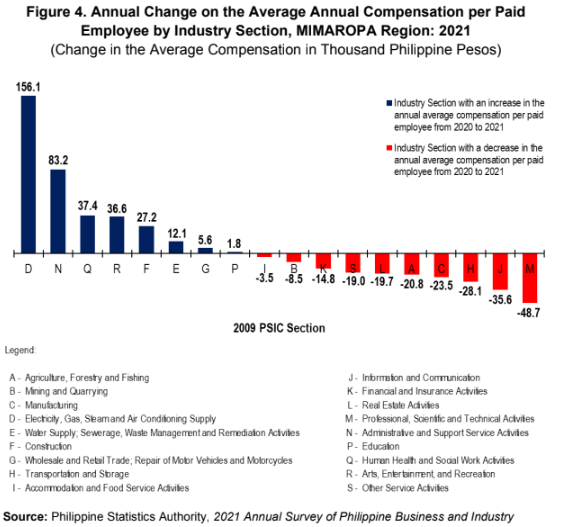
In terms of annual increase, the Electricity, Gas, Steam and Air Conditioning Supply
contributed the highest increase among 18 sections to average annual compensation
of PhP 156,138 per paid worker in the region. This translates to an annual growth of 49.9 percent from PhP 312,852 in 2020. This was followed by the Administrative and
Support Service Activities section, projecting an increase to the average annual pay
by PhP 83,216 per paid employee (33.1% annual growth rate). The Human Health
and Social Work Activities section posted an additional PhP 37,367 to the average
annual pay per paid worker (21.9% annual growth rate). (Figure 4 and Table B)
Meanwhile, the Professional, Scientific and Technical Activities had the highest
decline in the average annual compensation among 18 sections. Each paid worker
under this section were compensated at an average of PhP 120,792 in 2021, which
was lower by PhP 48,726 or a negative growth rate of 48.7 percent from the average
annual pay of PhP 169,518 received by each paid workers in the previous year.
(Figure 4 and Table B)
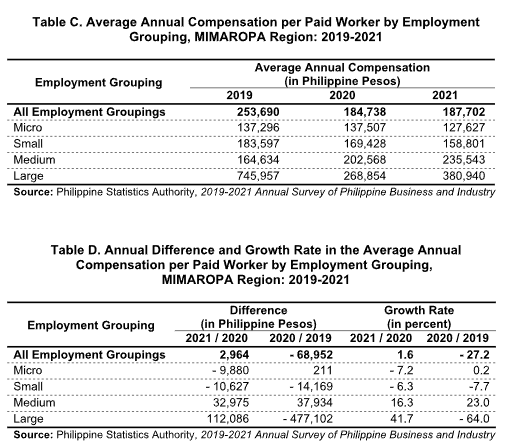
Paid workers in large establishments received the highest average annual
compensation
The 2021 ASPBI showed that large establishments paid the highest average of
PhP 380,940 per paid employee, exceeding the regional average of PhP 187,702.
This was followed by medium establishments paying an average annual compensation
of PhP 235,543 per paid employee, small establishments paying PhP 158,001 per
paid employee, and micro establishments paying PhP 127,627 per paid employee.
(Figure 5 and Table C)
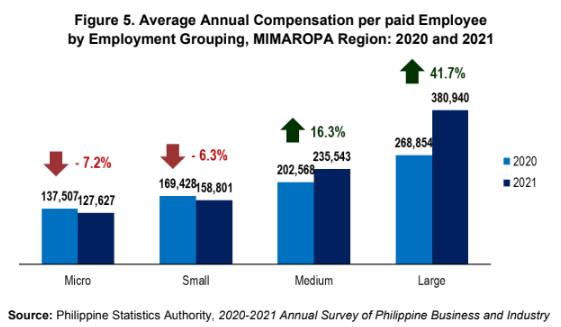
In 2021, both large and medium establishments contributed to the increase in the
average annual compensation per paid worker in the region. Paid workers in large
establishments were compensated with an additional PhP 112,086 (41.7% growth
rate) from their annual average compensation of PhP 268,854 in the previous year.
Likewise, every paid worker in medium establishments was compensated with an
additional PhP 32,975 (16.3% growth rate) from the estimated annual average
compensation of Php 202,568 in 2020. (Figure 5 and Table D)
Meanwhile, paid employees from both micro and small establishments received a
smaller average annual compensation in 2021. For small establishments, paid
workers received PhP 10,627 decline or 6.3 percent cutback from their annual
average of PhP 169,428 received in the previous year. Paid workers in micro establishments
received a cutback of PhP 9,880 or 7.2 percent lower than their annual average of
PhP 137,507 received in the previous year. (Figure 5 and Table D)

TECHNICAL NOTES
2021 Annual Survey of Philippine Business and Industry
I. Introduction
I.1. Background of the Survey
The Annual Survey of Philippine Business and Industry (ASPBI), one of the
designated statistical activities of the Philippine Statistics Authority (PSA), generates
essential statistics for economic planning and analysis. It is specifically designed to collect
and generate information on the levels, structure, performance, and trends of economic
activities of the formal sector of the country’s economy.
The 2021 ASPBI is the 49th in the series of annual surveys of establishments in the
country. It was conducted nationwide in April 2022 with 2021 as reference period. In this
round of the ASPBI, the 2021 Survey on Information and Communications (SICT) is a rider
to this survey.
The conduct of the 2021 ASPBI is authorized under Republic Act No. 10625, known
as the Philippine Statistical Act of 2013, which mandates the PSA to collect, compile,
analyze, and publish statistical information relating to the country’s economic condition.
I.2. Objectives
The 2021 ASPBI aims to collect and generate information on the levels, structure,
performance, and trends of economic activities of the formal sector of the economy for the
year 2021. Specifically, the 2021 ASPBI aims to:
1. collect and generate detailed information on employment, revenue, expense,
inventories, tangible fixed assets, intangible assets, and total assets of the
establishments,
2. generate estimates for other economic indicators such as value added, average
compensation, and other indicators which are necessary to evaluate the performance
of industries at the national and regional levels,
3. generate statistics for micro, small, and medium establishments (MSME) where
identification of MSME is based on total employment, and
4. gather pertinent information for the updating of the sampling frame of establishment-
based surveys.
I.3. Historical Information on the Survey
Annual surveys are usually conducted a year after the reference year. Except for the
survey conducted in 2002, the year in the survey title refers to the reference year. The
following are the annual surveys conducted:
1. 1956 Annual Survey of Manufactures (ASM) – First annual survey of establishments
undertaken since the Bureau of Census and Statistics (BCS) was established in 1940. It was conducted jointly by the National Economic Council (now the National
Economic and Development Authority or NEDA) and the BCS with technical
assistance provided by the International Cooperation Administration (ICA) of the
United States (US). The ICA is the predecessor of the now US Agency for
International Development (USAID).
2. 1957 ASM – This was also conducted jointly by NEDA and BCS.
3. 1958 ASM – This survey was integrated as a regular activity of the BCS.
4. 1959, 1960, 1962, 1963, 1964, 1965, and 1966 ASM – Annual Surveys of
Manufactures were conducted for these years.
5. 1965 Annual Survey of Wholesale and Retail Trade (ASWRT) was conducted for the
City of Manila only. The 1966 ASWRT was expanded to cover both the City of Manila
and suburbs, but there were no available publications.
6. 1968 and 1969 – The ASM and the ASWRT were conducted.
7. The 1968 ASWRT was the start of the annual series for wholesale and retail trade at
the national level.
8. 1970 and 1971 Annual Survey of Establishments (ASE) – The scope of the annual
survey was expanded to include the business, utilities, and services sectors, aside
from manufacturing, and wholesale and retail trade.
9. 1973 and 1974 ASE – The coverage of the 1971 ASE was expanded to include
Mining and Quarrying; Construction; and Transportation, Communication and
Storage; Electricity, Gas, and Water; Financing; Insurance; Real Estate and Business
Services were included for the first time in the 1974 ASE.
10. 1976 ASE – The annual survey was conducted for all sectors, which was also the
start of the Annual Surveys of Agriculture, Forestry and Hunting, and Fishing.
11. 1977, 1979, 1980, 1981, 1982, 1984, 1985,1986, 1987, 1989, 1990, 1991, 1992,
1993 and 1995 – Annual surveys for all sectors were conducted for these years.
12. 1996 and 1997 ASE – Only one survey was conducted for all sectors to collect data
for two years, 1996 and 1997.
13. 1998 ASE – Annual survey was conducted for all sectors.
14. 2000 – No annual survey was conducted for this reference year.
15. 2001 – The title of the survey for this reference year was renamed as 2002 Annual
Survey of Philippine Business and Industry (ASPBI). This was based on NSCB
Resolution No.3 Series of 2000 which approved the change in the title of Census of
Establishments to 2000 Census of Philippine Business and Industry (CPBI) and
changed the title to the year when the census was undertaken. Thus, the title of the
ASE was changed accordingly to ASPBI.
16. 2002 – No annual survey was undertaken for this reference year.
17. 2003 ASPBI – Starting with the 2003 ASPBI, the year in the survey title referred
again to the reference year. The survey was conducted in 2004.
18. 2004 – No annual survey was undertaken for this reference year.
19. 2005 ASPBI – An annual survey was conducted in 2006 instead of the originally
planned 2005 Census of Philippine Business and Industry.
20. 2007 and 2011 – No annual survey was undertaken for these reference years.
21. 2009, 2010, 2013, 2014, 2015, 2016, 2017, 2019 and 2020 ASPBI – The surveys
were conducted for these reference years.
An economic census of establishments was undertaken for reference years 1903,
1918, 1939, 1948, 1961, 1967, 1972, 1975, 1978, 1983, 1988, 1994, 1999, 2006, 2012, and 2018. Except for 1999, the title of the census refers to the year the census was conducted.
For these years, no annual surveys were undertaken.
I.4. Scope and Coverage
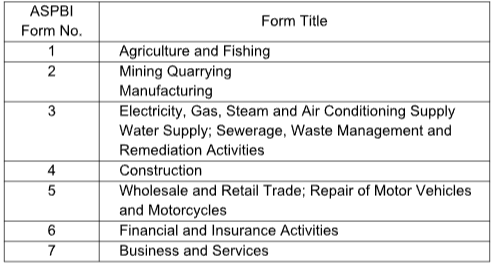
The 2021 ASPBI covered establishments engaged in 18 sections classified according
to the 2009 Philippine Standard Industrial Classification (PSIC), namely:
1. Agriculture, Forestry, and Fishing (A)
2. Mining and Quarrying (B)
3. Manufacturing (C)
4. Electricity, Gas, Steam, and Air Conditioning Supply (D)
5. Water Supply; Sewerage, Waste Management, and Remediation Activities (E)
6. Construction (F)
7. Wholesale and Retail Trade; Repair of Motor Vehicles and Motorcycles (G)
8. Transportation and Storage (H)
9. Accommodation and Food Service Activities (I)
10. Information and Communication (J)
11. Financial and Insurance Activities (K)
12. Real Estate Activities (L)
13. Professional, Scientific, and Technical Activities (M)
14. Administrative and Support Service Activities (N)
15. Education (P)
16. Human Health and Social Work Activities (Q)
17. Arts, Entertainment, and Recreation (R)
18. Other Service Activities (S)
The survey was confined to the formal sector of the economy, which consists of the
following:
1. Corporations and partnership, regardless of employment size,
2. Cooperatives and foundations, regardless of employment size,
3. Single proprietorships with branches, regardless of employment size, and
4. Single proprietorship with no branches but with total employment (TE) of 10 and over.
Hence, the 2021 ASPBI covered all establishments regardless of employment size,
except those establishments with:
1. Legal Organization of single proprietorship (LO=1),
2. Economic Organization of single establishment (EO=1), and
3. TE of less than 10.
II. Data Collection
II.1. Data Collection
The survey was conducted nationwide in 2022 with 2021 as the reference period,
except for employment where the reference period is as of 15 November 2021.
Distribution and collection of 2021 ASPBI questionnaires were done according to a
timetable set. Distribution was done in April 2022 through personal visits by PSA field staff to
the sample establishments located in the provinces and cities nationwide. The collection of
accomplished questionnaires started one week after distribution.
II.2. Survey Instruments
The 2021 ASPBI utilized seven forms of questionnaires which captured data of
sample establishments engaged in the 18 sections of the economy as defined in the 2009
PSIC. The seven forms of questionnaires are presented in the table below:
Each form of the survey questionnaire is available in three options. These are the
following:
1. online questionnaire which can be accessed at https://aspbi.psa.gov.ph,
2. electronic copy of the questionnaire, either in portable document format (.pdf) or
Excel (.xlsx) file format, and
3. printed copy of the self-administered questionnaire.
The sample establishment can choose from these options in recording the
information for the data items in the survey questionnaire.
II.3. Data Items
The survey collected data on employment, revenue, expense, sales from e-
commerce transactions, capital expenditure, book value of fixed tangible and intangible
assets, average capacity utilization rate, and inventory.
II.4. Data Processing
To ensure quality of survey reports, several levels of validation following guidelines
set were done during the processing phase of the survey operation.
Computer systems were also developed and used to facilitate the smooth conduct
and monitoring of the survey operation. These were the Monitoring and Tracking System
(MTS) and the Establishment Data Management System (EDMS) which are online systems.
The MTS was used to monitor the real-time progress of the survey operation, which included
distribution, collection, transmittal, manual processing, and data processing of
questionnaires, among others. On the other hand, the EDMS was used in the processing of
data and tabulation of survey results.
III. Methodology
III.1. Sampling Frame
The sampling frame for the 2021 ASPBI was extracted from the preliminary 2021 List
of Establishments (LE) updated as of 24 January 2022. This frame was used to draw the
sample establishments for the survey. The preliminary 2021 LE showed that there were
1,079,093 establishments that were in operation in the country of which 349,071
establishments comprised the sampling frame or the establishments that are within the
scope and coverage of the 2021 ASPBI.
III.2. Sample Selection Procedure
The 2021 ASPBI uses a stratified systematic sampling design with 3-digit or 5-digit
PSIC as the first stratification variable, depending on the section and total employment,
which is classified into Micro, Small, Medium establishments (MSME), as the second
stratification variable.
Stratified systematic sampling is a process of dividing the population into
homogeneous groups, called strata, and then selecting independent samples in each
stratum systematically. This method ensures that all important subgroups of the population
are represented in the sample and increases the precision of “overall” survey estimates.
Domain
The geographic domain of the 2021 ASPBI is the region. The industry
domain/stratum is a 3-digit or 5-digit industry classification, and the employment
domain/stratum is the MSME classification.
Unit of Enumeration
The unit of enumeration for the 2021 ASPBI is the establishment.
III.3. Estimation Procedure
III.3.1. Weights Computation
Base Weight
The base weight is the inverse of the probability of selection. For the ASPBI, the
base weight for each domain is given by:

where w hk is the base weight of the k-th establishment in the h-th stratum, N h is the total
number of establishments in the h-th stratum, n h is the total number of sample
establishments in the h-th stratum, and h refers to the industry-employment stratum.
Adjustment Factor
To take into account the non-responding sample establishments, the adjustment factor by
region and industry section is as follows:
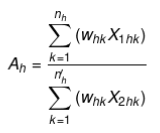
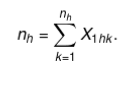
where A h refers to the adjustment factor in the h-th stratum, w hk is the base weight of the k-th
establishment in the h-th stratum, X 1hk is the eligibility status of the k-th sample establishment
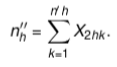
in the h-th stratum (i.e., 1 if eligible, 0 otherwise), X 2hk is the responding status of the k-th
sample establishment in the h-th stratum, n h is the total number of sample establishments in
the h-th stratum, and n’ h is the total number of eligible sample establishments in the h-th
stratum, that is,
Final Weight
The final weight is the product of the base weight and adjustment factor. That is,
where w fhk is the final weight of the k-th establishment in the h-th stratum, A hk is the
adjustment factor of the k-th establishment in the h-th stratum, and w hk is the base weight of
the k-th establishment in the h-th stratum.
III.3.2. Estimation of Total
Total by Industry-Employment Stratum (h)
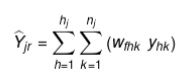
The estimator for the total of a characteristic in each industry-employment stratum (h) in a
region (geographic domain) is given by:
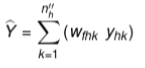
where y hk is the value of the k-th establishment in the h-th stratum, w fhk is the final weight of
the k-th establishment in the h-th stratum, and n’’ h is the total number of establishments in
the h-th stratum, that is,
Total by Industry Stratum per Region
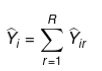
The estimator for the total of a characteristic in each industry stratum in a region is given by:
where r is the subscript for geographic domain, h i is the number of employment strata for the
i-th industry stratum, and n i is the number of employment stratum for the i-th industry
stratum.
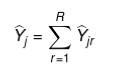
Total by Employment Stratum per Region
The estimator for the total of a characteristic in each employment stratum for the regional
domain is given by:
where h j is the number of industry strata for the employment stratum j, r is the subscript for
geographic domain, and n j is the number of responding sample establishments in the j-th
employment stratum.
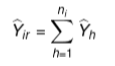
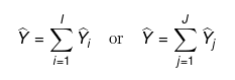
Total by Geographic Domain
The estimator for the total of a characteristic in each geographic domain is given by:
where I r is the total number of industry strata in geographic domain r, and J r is the total
number of employment data in geographic domain r.
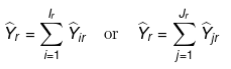
Total by Industry Stratum (National)
The estimator for the national total of a characteristic in each industry domain/stratum is
given by:
where R is the total number of regions.
Total by Employment Stratum (National)
The estimator for the national total of a characteristic in each employment domain/stratum is
given by:
where R is the total number of regions.
National Total
The estimator for the national total of a characteristic is given by:
where I is the total number of industry strata, and J is the total number of employment strata.
IV. Concepts and Definition of Terms
An establishment is defined as an economic unit under a single ownership or control
which engages in one or predominantly one kind of economic activity at a single fixed
location. An establishment is categorized by its economic organization, legal organization,
industrial classification, employment size, and geographic location.
Geographic Classification refers to the grouping of establishments by geographic
area using the Philippine Standard Geographic Code (PSGC) classification. The PSGC
contains the latest updates on the official number of regions, provinces, cities, municipalities,
and barangays in the Philippines. The PSGC as of 31 December 2021 was used for the
2021 ASPBI.
Size of an establishment is determined by its total employment as of the time of visit
during the latest Updating of the List of Establishments.
Total Employment (TE) refers to the total number of persons who work in or for the
establishment. This includes paid employees, working owners, unpaid workers, and all
employees who work full-time or part-time including seasonal workers. Also included are
persons on short-term leave such as those on sick, vacation or annual leaves, and on strike.
Compensation is the sum of salaries and wages, separation/retirement/terminal pay,
gratuities, and payments made by the employer on behalf of the employees such as
contribution to SSS/GSIS, ECC, PhilHealth, Pag-ibig, etc.
Salaries and wages are payments in cash or in kind to all employees, prior to
deductions for employee’s contributions to SSS/GSIS, withholding tax, etc. Included are total
basic pay, overtime pay, and other benefits.
Paid employees are all persons working in the establishment and receiving pay, as
well as those working away from the establishment paid by and under the control of the
establishment. Included are all employees on sick leave, paid vacation, or holiday. Excluded
are consultants, home workers, receiving pure commissions only, and workers on indefinite
leave.
V. Dissemination of Results and Revision
The results of the 2021 ASPBI are disseminated through the posting of Special Releases
and electronic publications on the PSA website, and final statistical tables in OpenStat. The
updating or revisions on data were done upon finalizing the results of the 2021 ASPBI data.
This Special Release presents the results of the 2021 ASPBI for All Establishments
(Economy-wide) in the MIMAROPA Region. Data are presented by section or 1-digit
classification as classified under the 2009 PSIC.