

Release Date :
Reference Number :
2022-024
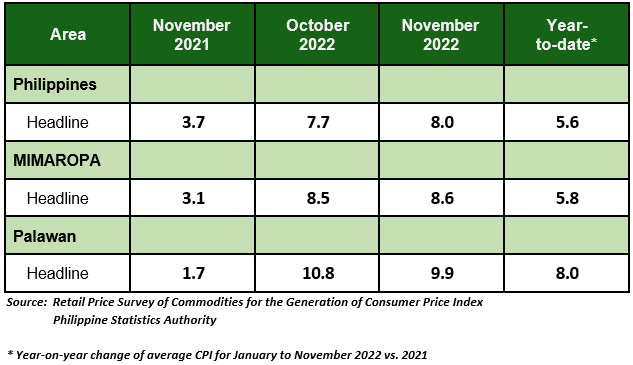
Table A. Year-on-Year Inflation Rates: Philippines, MIMAROPA, and Palawan All Items, In Percent (2018=100)
Palawan
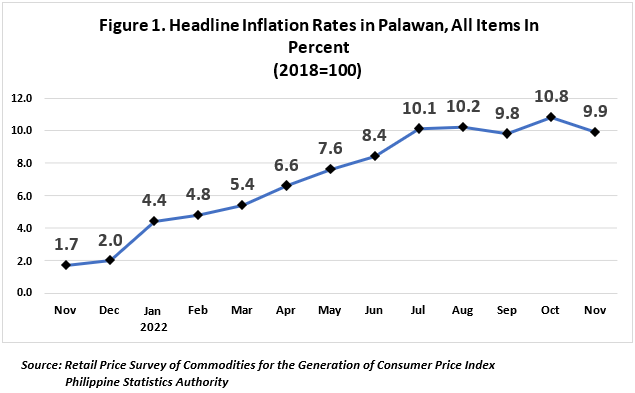
The headline inflation in Palawan declined to 9.9 percent in November 2022, from 10.8 percent in October 2022. The average inflation for the first eleven months of the year stood at 8.0 percent. (Table A and Figure 1)
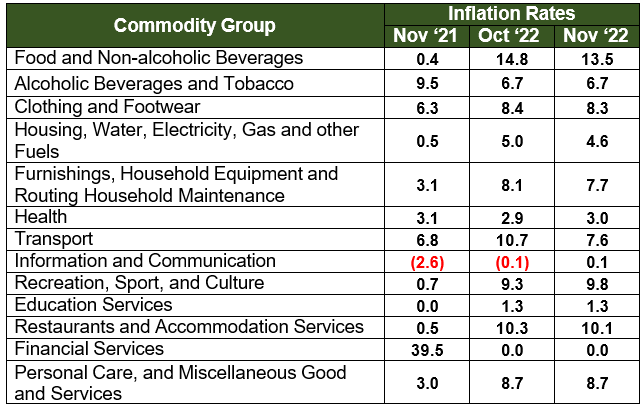
The downtrend in the provincial inflation is attributed to the lower annual increments in the index for Food and non-alcoholic beverages at 13.5 percent, from 14.8 percent in October 2022. Contributing to the downtrend was also observed in Transport at 7.6 percent, Housing, water, electricity, gas and other fuels at 4.6 percent, Furnishings, Household Equipment and Routine Household Maintenance at 7.7 percent, Clothing and Footwear at 8.3 percent and Restaurant and Accommodation services at 10.1 percent (Table B). Furthermore, higher indices were observed in the following commodity groups:
a. Recreation, Sport, and Culture, 9.8 percent.
b. Health, 3.0 percent
c. Information and Communication, 0.1 percent
On the other hand, the rest of the commodity groups retained their previous month’s inflation rates.
Table B. Year-on-Year Inflation Rates in Palawan, All Items In Percent (2018=100)
Food index in November 2022 slowed down to 13.8 percent, from 15.3 percent in the previous month. In November 2021, the food index was lower, at 0.2 percent. (Table C)
During this period, major contributors to the downtrend in the food index are Vegetables, tubers, plantains, cooking bananas and pulses at 7.3 percent, followed by Meat and other parts of slaughtered land animals at 17.5 percent; and Oils and fats at 14.1 percent. Other contributors to the decrease in the food index are Ready-made food and other food products n.e.c. at 13.7 percent, Fish and other seafood at 23.4 percent, Cereals at 5.8 percent, and Rice at 5.8 percent.
Meanwhile, other commodities posted higher indices such as Corn at 6.8 percent, Sugar, Confectionery, and desserts at 65.1 percent, Flour, Bread and other Bakery Products, Pasta Products and other Cereals at 13.6 percent, Milk, other dairy products, and eggs at 8.0 percent, and Fruits and Nuts, at 20.3 percent.
Table C. Year-on-Year Inflation Rates in Palawan, By Food Group In Percent (2018=100)
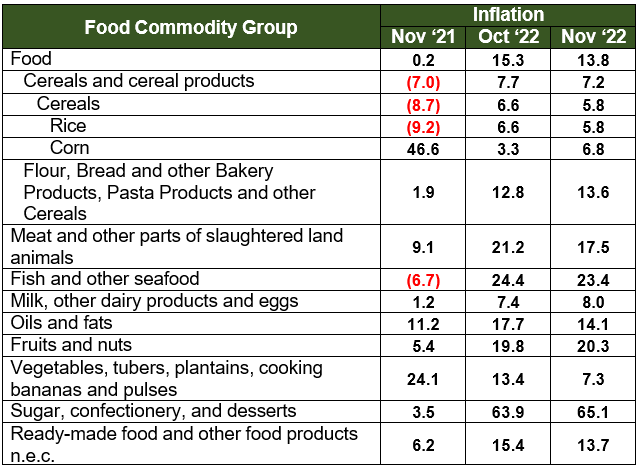
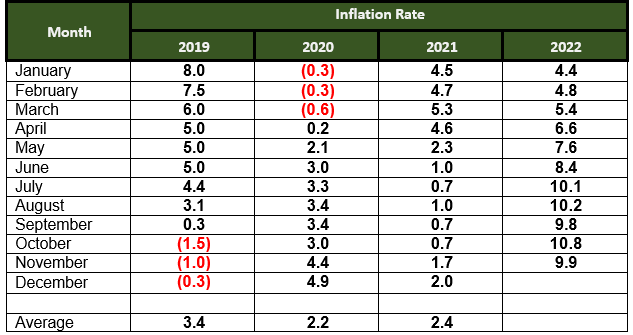
Table D. Year-on-Year Inflation Rates in Palawan, All Items In Percent January 2019 – November 2022 (2018=100)

| Attachment | Size |
|---|---|
|
|
456.77 KB |