

Release Date :
Reference Number :
2023-09
Palawan
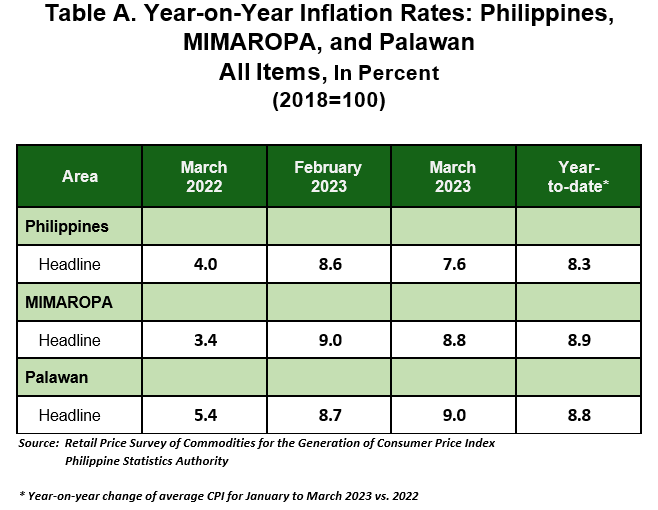
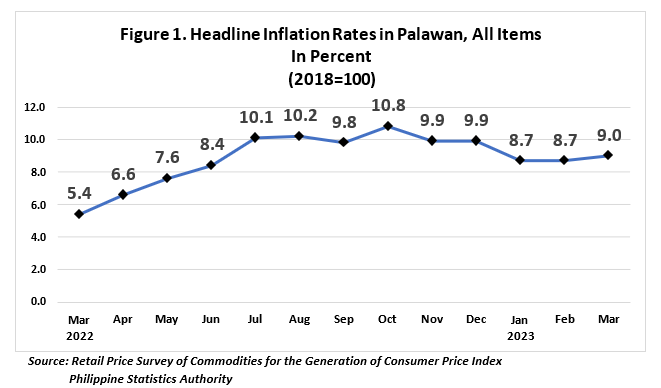
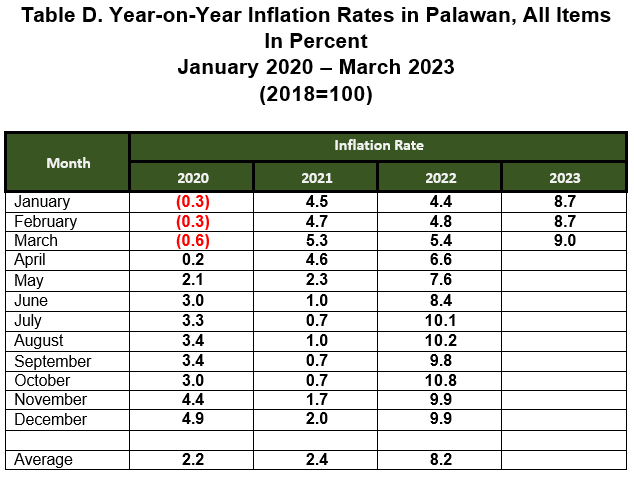
The headline inflationin the province of Palawan registered another uptrend of 9.0 percent in March 2023, from 8.7 percent in February 2023. In March 2022, inflation rate is lower at 5.4 percent. The average inflation rate for the first quarter of the year stood at 8.8 percent, (Table A and Figure 1).
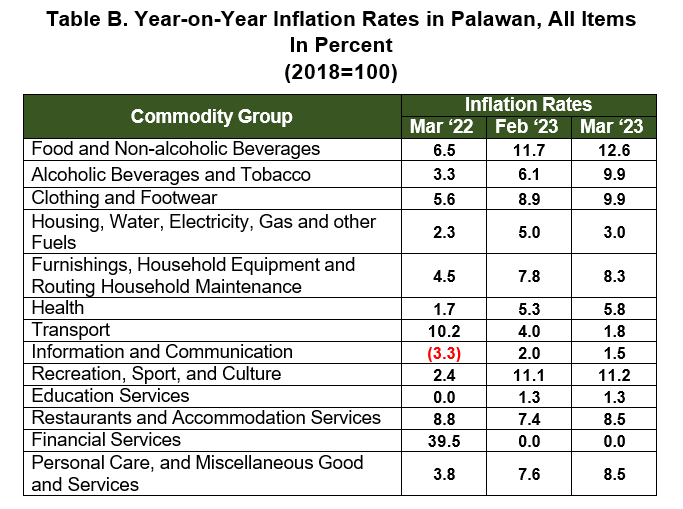
The uptick in the provincial inflation in March was caused mainly by higher annual increments in the heavily weighted Food and Non-Alcoholic Beverages at 12.6 percent, from 11.7 percent in February 2023. This was followed by Alcoholic Beverages and Tobacco at 9.9 percent, from 6.1 percent
in the previous month. The third primary driver on the uptick was Restaurant and Accommodation Services which recorded an 8.5 percent inflation rate from 7.4 percent last month.
Moreover, uptrends were also observed in the indices of the following commodity groups:
- Clothing and Footwear,9.9 percent;
- Personal Care, and Miscellaneous Good and Services, 8.5 percent;
- Furnishings, Household Equipment and Routine Household Maintenance, 8.3 percent;
- Health, 5.8 percent; and
- Recreation, Sport and Culture, 11.2 percent.
On the other hand, downtrends were noted in the indices of the following commodity groups:
- Housing, Water, Electricity, Gas and other Fuels, 3.0 percent;
- Transport, 1.8 percent; and
- Information and Communication, 1.5 percent;
Meanwhile, the rest of the other commodity groups retained their previous month’s inflation rates.
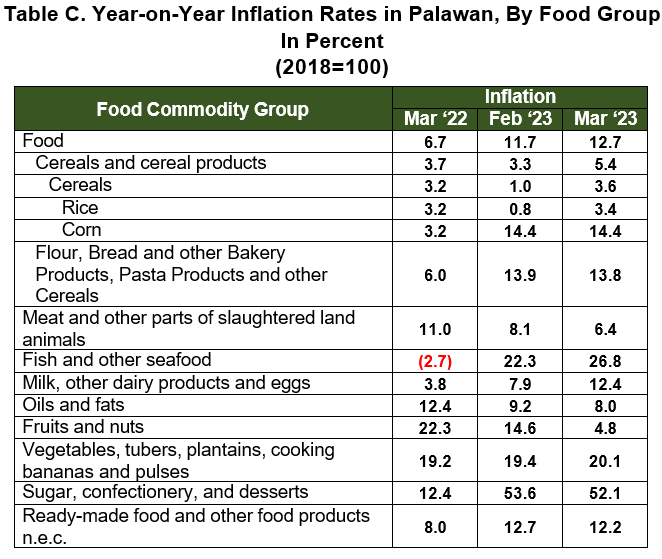
Food index in March 2023 further accelerated to 12.7 percent inflation rate, from 11.7 percent in the previous month. In March 2022, the food index was lower, at 6.7 percent inflation rate, (Table C).
The uptrend in the food index can be attributed to the higher indices in Rice at 3.4 percent, Fish and Other Seafood at 26.8 percent, Milk, Other Dairy Products and Eggs at 12.4 percent, and Vegetables, Tubers, Plantains, Cooking Bananas and Pulses, at 20.1 percent.
On the other hand, lower indices were observed in the following commodity groups:
Sugar, Confectionery and Desserts, 52.1 percent;
Flour, Bread and other Bakery Products, Pasta Products and other Cereals, 13.8 percent;
Meat and Other Parts of Slaughtered Land Animals, 6.4 percent;
Ready-made Food and Other Food Products n.e.c., 12.2 percent;
Fruits and Nuts, 4.8 percent; and
Oils and Fats, 8.0 percent.

| Attachment | Size |
|---|---|
|
|
462.96 KB |